Non-Binary Gender Inclusion
Overview
Non-binary genders are often overlooked in society, including NYC. A majority of society identifies
themselves as either male and female. However, there exists people who do not fit into these categories
and are not being properly documented. To have more non-binary gender inclusions, gender-neutral bathrooms
should be accessible, there should be gender-neutral pronouns, and their gender identification on official
documents should be recorded appropriately.
I plan to show the lack of inclusion of non-binary genders on NYC
databases by using plots, bar graphs. Since gathering data proved to be difficult, I will provide enough
data to demonstrate the difference of documentation between binary genders and non-binary genders.
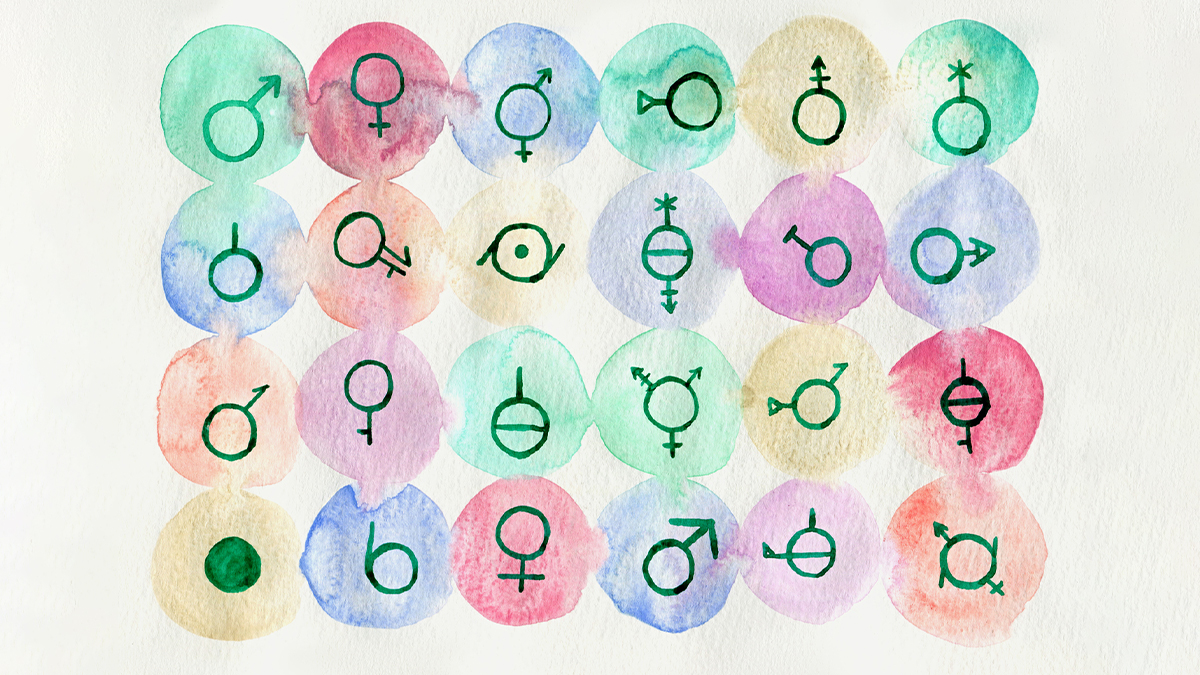
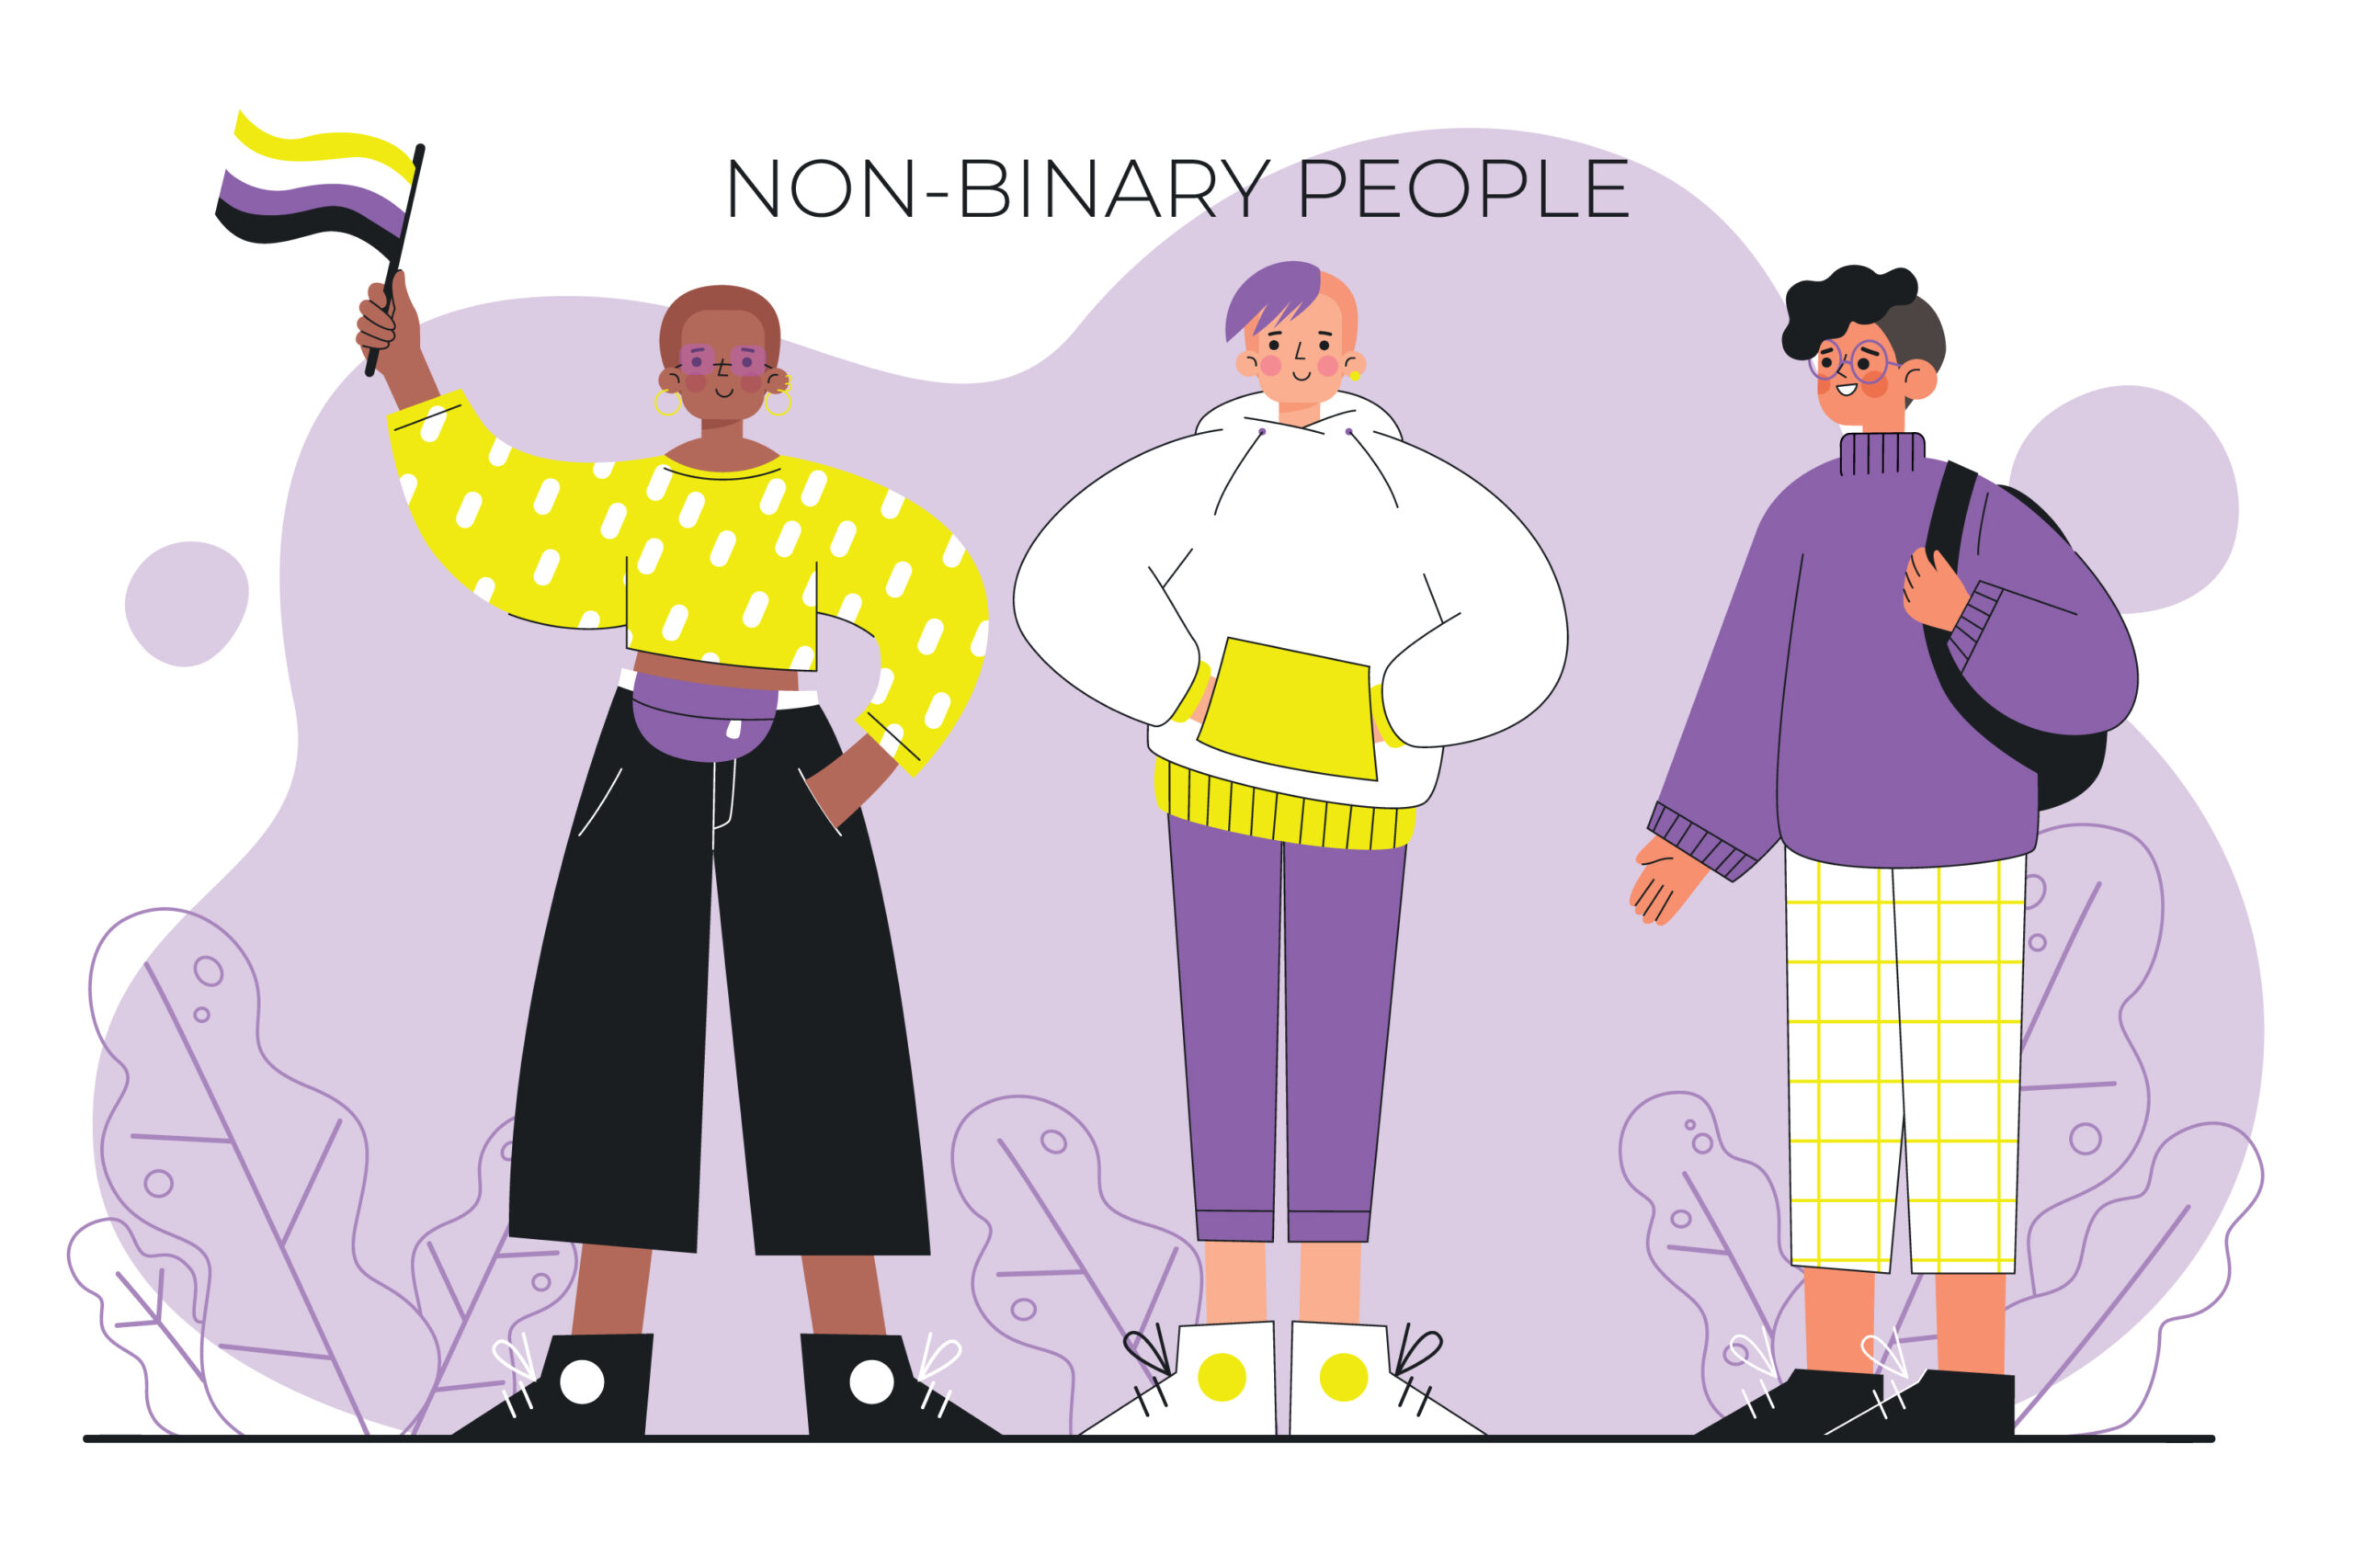
What is Non-Binary Gender?
The concept that there are only two genders, male and female, is called a ‘gender binary’
because binary consists of only two alternatives choices. This is how some people in society
recognize genders. Thus, ‘non-binary gender’ is a term used to describe genders that do not
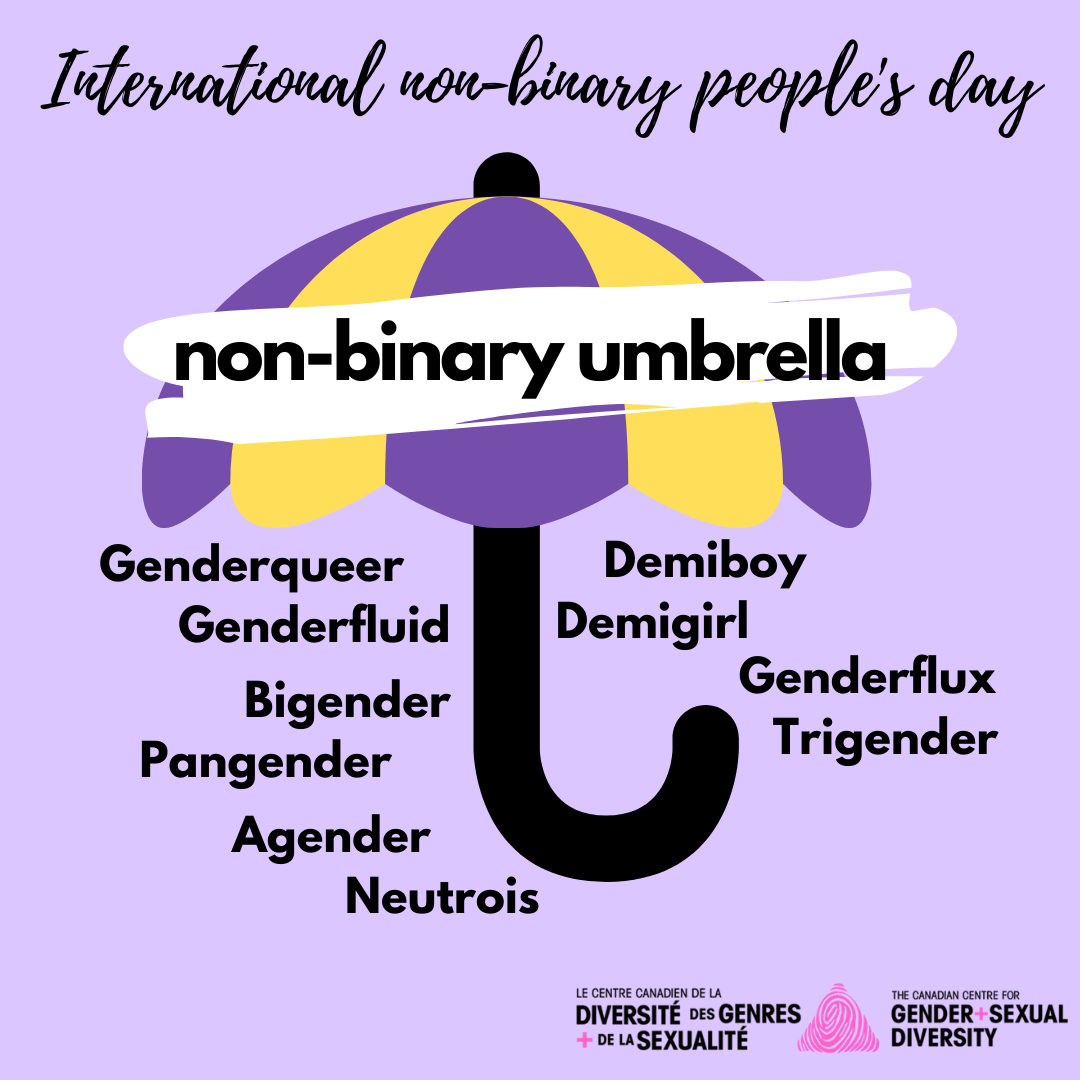
fall intro the categories presented in the gender binary, male and female. Non-Binary Gender
is an umbrella term. Therefore, people under this umbrella may identify themselves differently
from one another or may not use this term either.
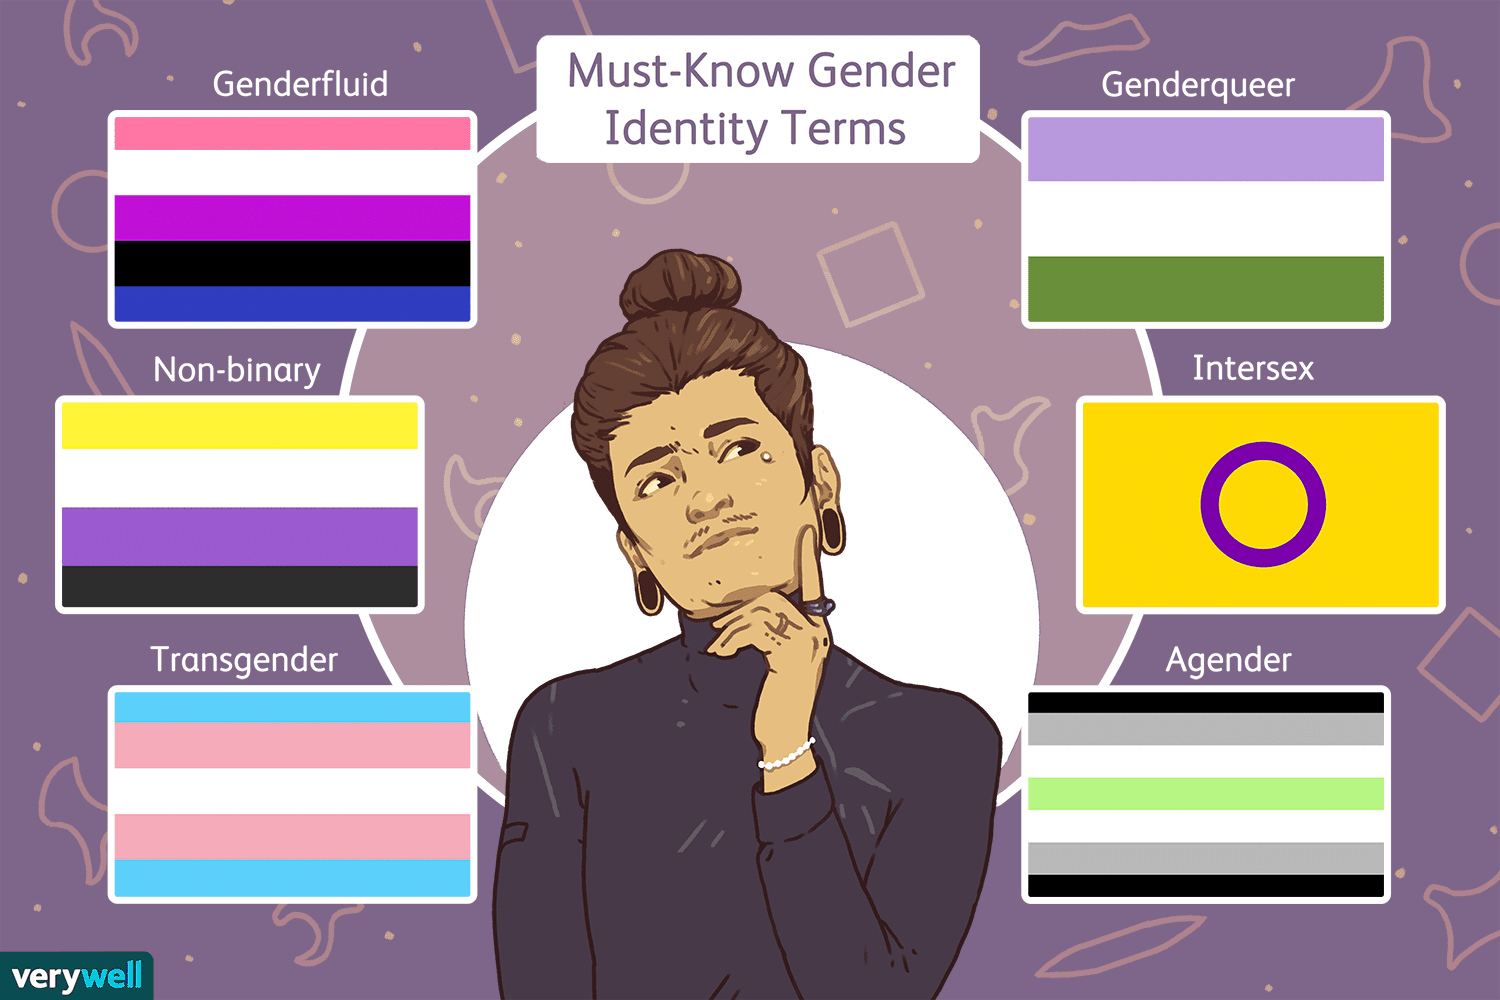
For instance, other gender identifies that do not fall within the gender binary are
Gender Fluid, Genderqueer, Bigender, Agender, Two-Spirit, etc.
NYC Open Data and United States Census Bureau
NYC Open Data
is free public data published by New York City agencies and other partners. The
United States Census Bureau
is a principal agency of the U.S. Federal Statistical System, responsible for
producing data about the American people and economy
This section will focus on official documentations and information that the public has access to.
All Data collected here are from NYC Open Data and the United States Census Bureau. Each data set
is refined to gather the necessary information presented below.
Social Service Demographic
This dataset provides a Demographic breakdown of only DYCD-funded participants within a Borough of NYC. The data displays the counts, and percentages of the participants in each of the following categories:
● Gender (Male, Female, Unknown)
● Ethnicity (Hispanic/Latino, non-Hispanic/non-Latino)
● Race (Pacific Islander, American Indian, Asian, White, Black, Other, Unknown)
This data is used to measure the numbers of the different population groups that are served by DYCD for a Borough, and Community. For this project, we will narrow the data to Gender Identificaiton and the options available in this breakdown.
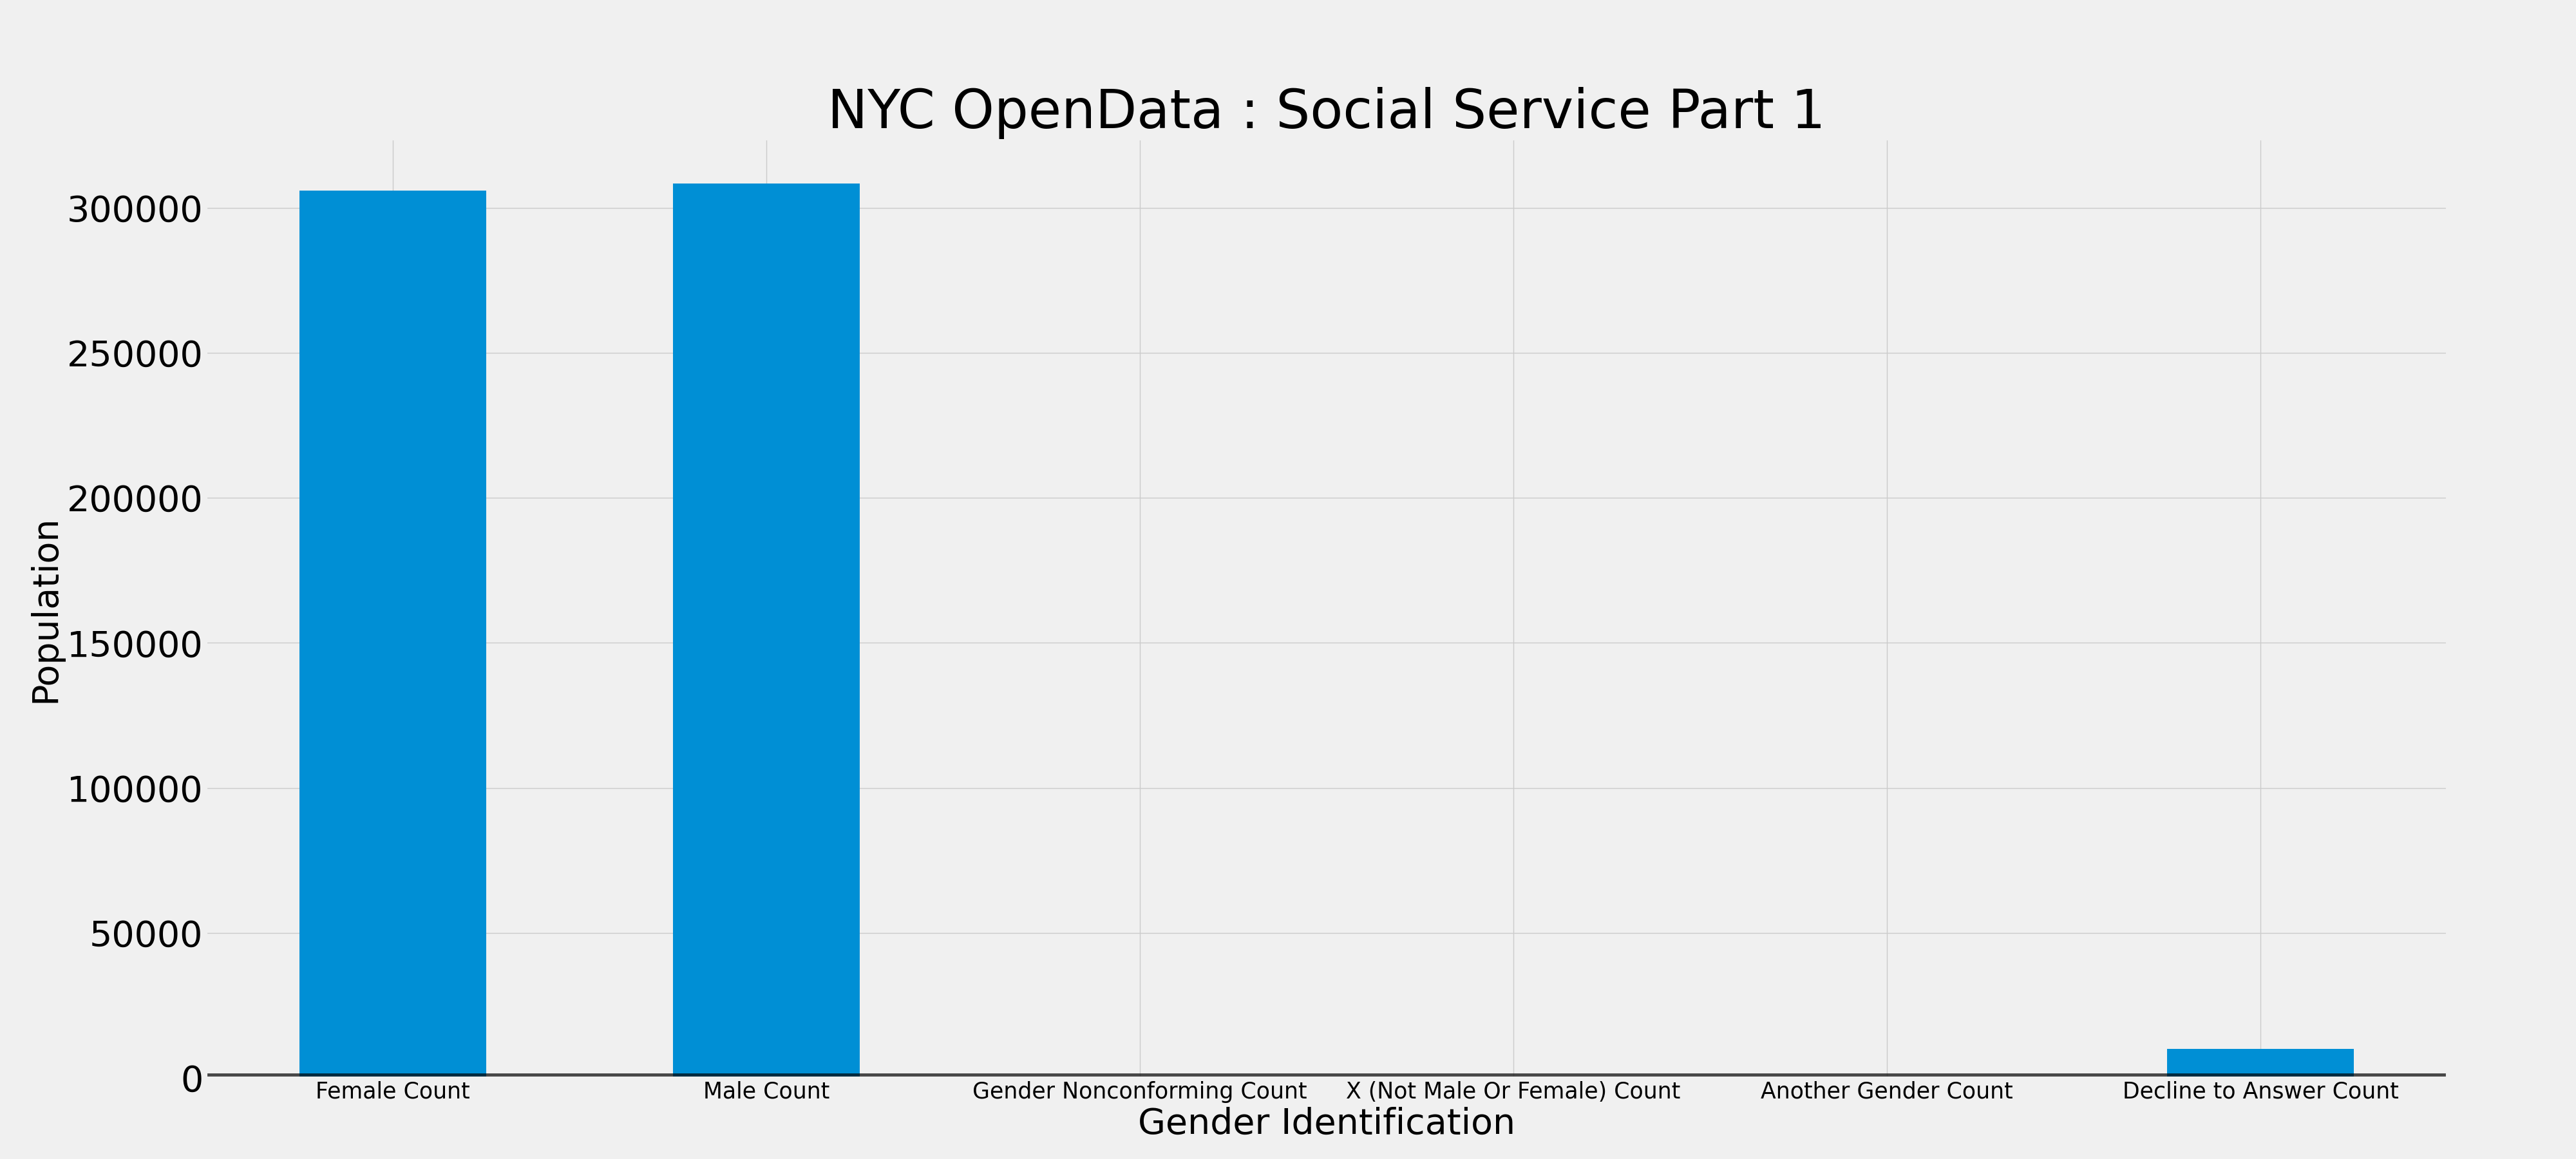
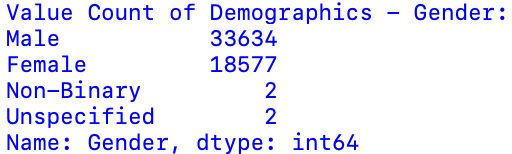
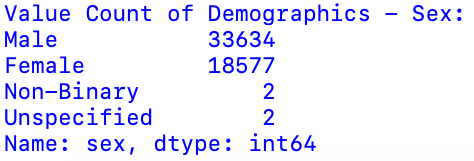
When gatheirng databases, it was difficult to find one where it takes into account the different types of genders thart
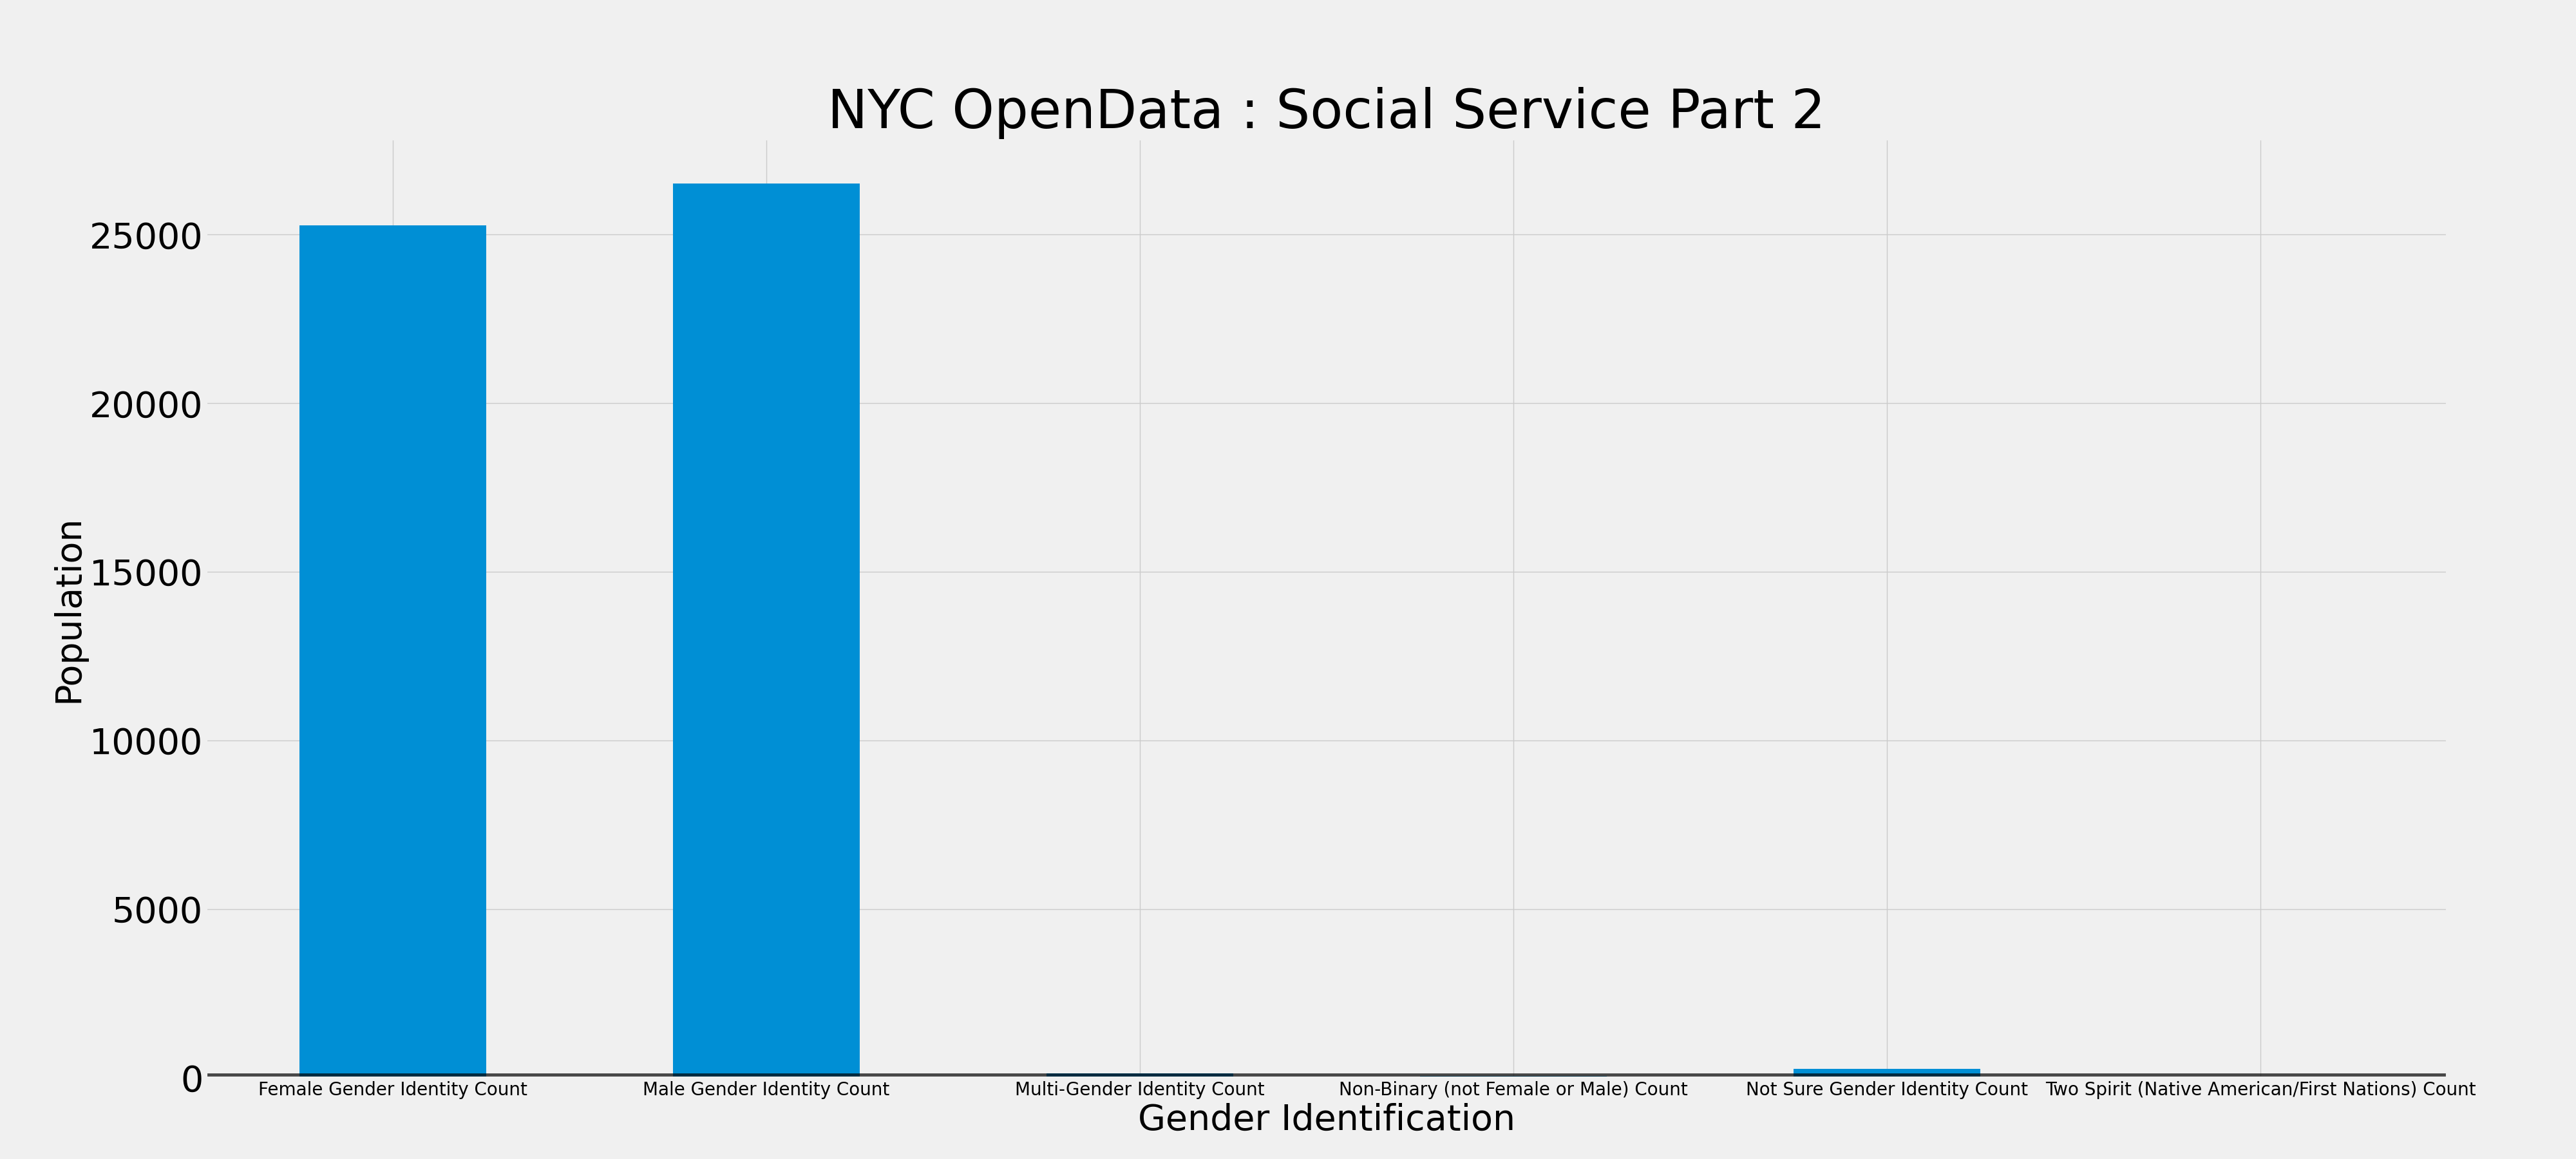
fall under non-binary gender. Social Service was the rare database to contained a variety of options. As assumed, there
is a majority of people identifying as male or female.
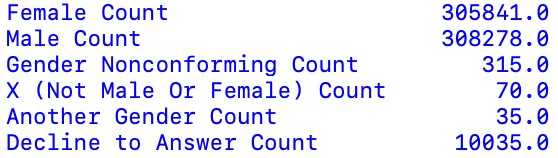
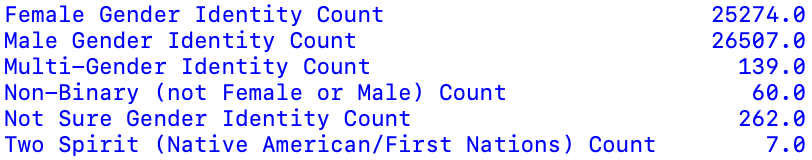
This data set, was split into two sections to make the bar graphs easier to understand and view. Since the graph could not
accurately represent the statistics gathered from this dataset, next to each graph, is their respected statistics. There are
two cases where binary gender were mentioned and documented. The data set did not elaborate how Male/Female Count differs from
Male/Female Identity Count. However, assumptions may beleive that Count includes some of the non-binary gender population.
Without verification, we do not know and remain with this skewed data set.
Furthermore, it is important to notice, that while there are more choices, the majority of people decided to decline an answer towards their gender identification. While this is perfectly fine, we still do not get a clear and accurate picture of the gender identity of the population.
NYPD Personnel Demographics
The next data set, we are analyzing is the list of NYPD members of service provided by the New York Police Department (NYPD).
We are looking at the database fromw hen it was last updated: October 22, 2021.
The data displays the counts, and description of the participants in each of the following categories:
Gender, Race, MOS_Type, ranklit, sex, appdate, YearsOnJob, and YearsOnJob (bins).

For our purpose, we analyzed the gender and the sex. In this case, they both ahppened to be the same. However, it is important
to note that a person's gender and sex is not alwasy the same. Sex is your biological anatomy that is usually assigned to a
perosn at birth, while Gender is a person's own self identification, which may change.
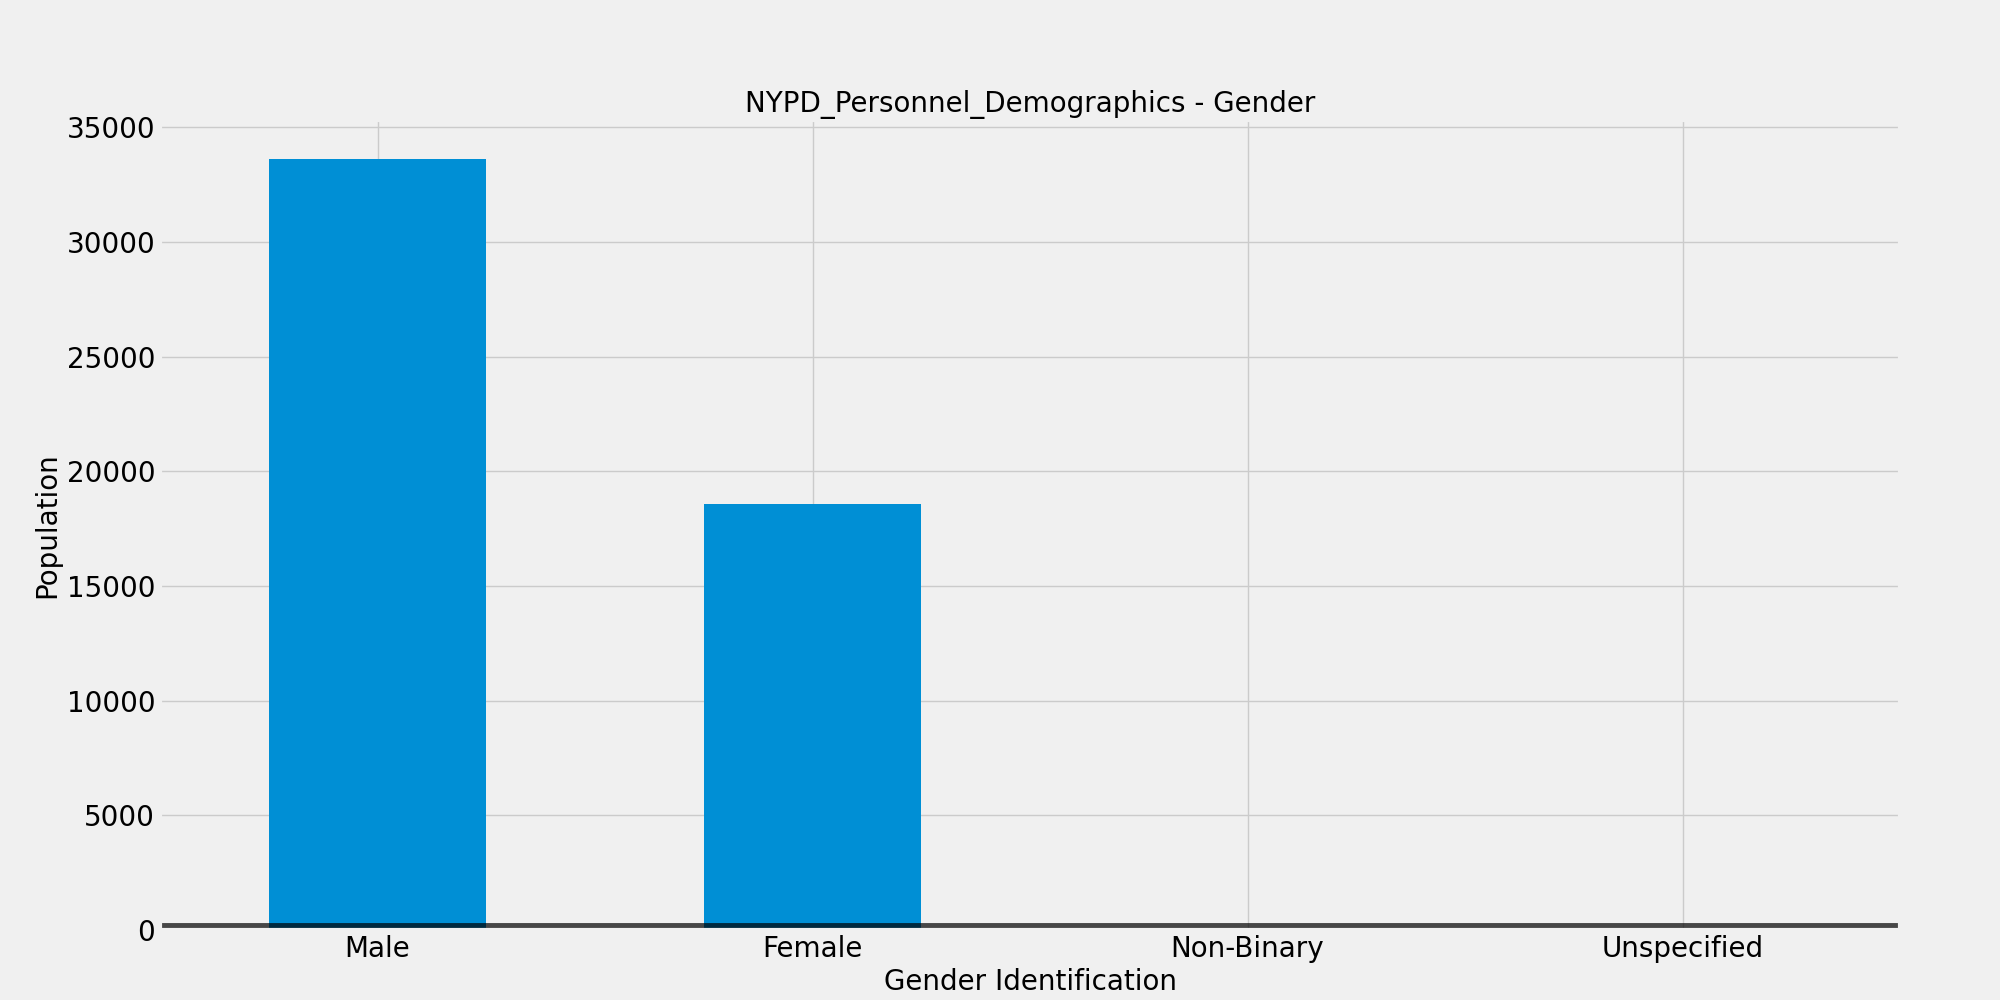
In both cases, binary genders was the majority of the population that was documented. While this specific database does have
the option of unspecified and non-binary, there are still cases where there are no other options but the binary genders.
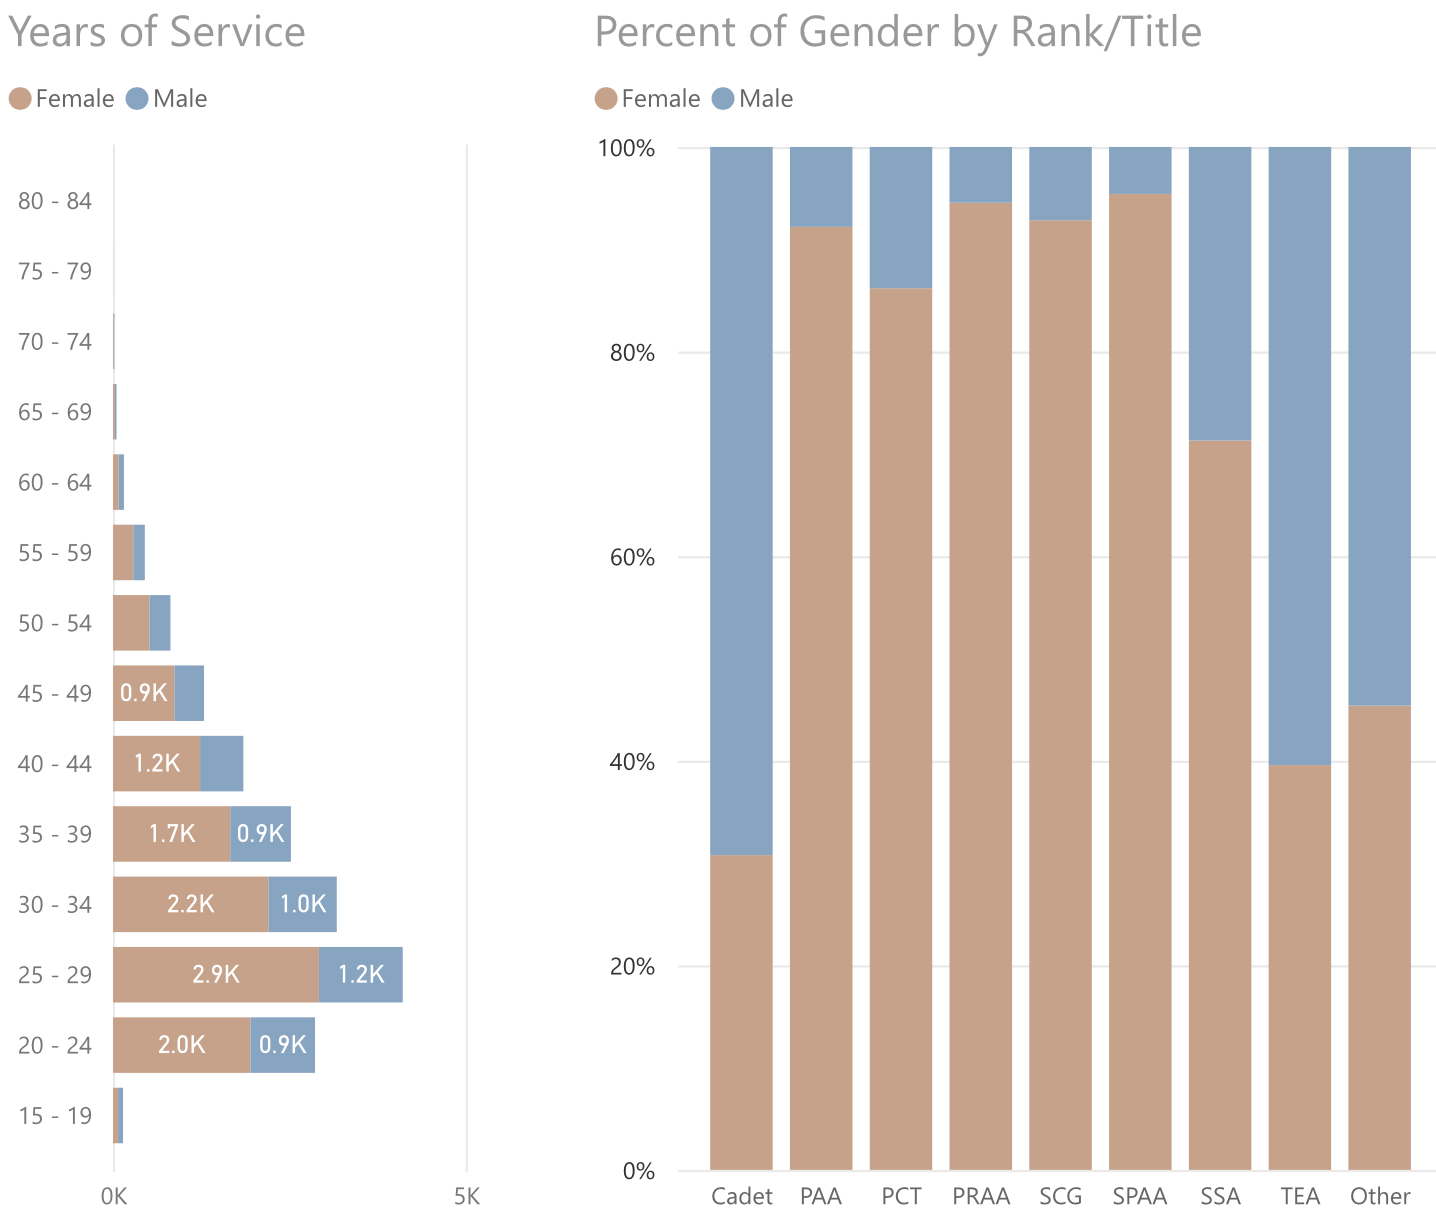
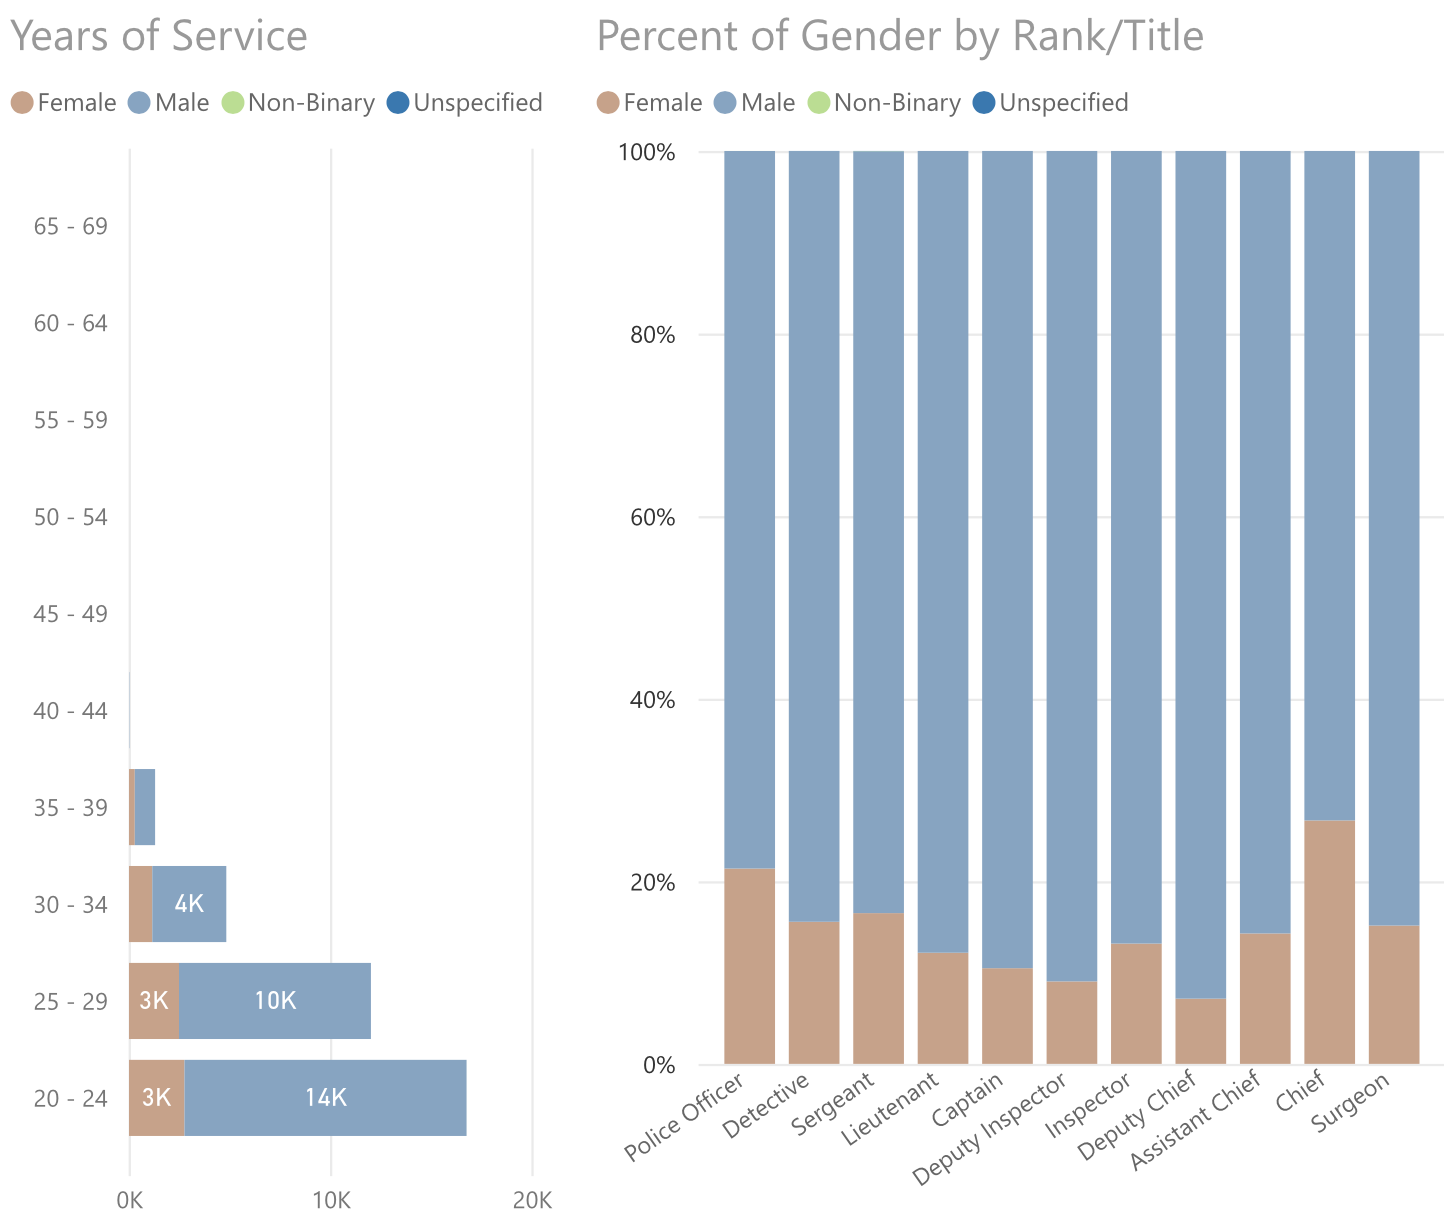
The graphs above are from NYPD Reports and Statistical Analyses Personnel Demographics Dashboard. The NYC Population is 8,336,817 while the Civilian data set is 17,457 and the Uniform data set is 35,047.
"The New York City Police Department (NYPD) is the largest and one of the oldest municipal police departments in the United States, with approximately 36,000 officers and 19,000 civilian employees. This dashboard provides a breakdown of our members by race, gender and rank/title."
As demonstrated, binary gender is the default choices and often the only choices. In NYPD, there is a lack of inclusion of non-binary genders. Although the graphs do state 'non-binary' and 'unspecified' for those of Uniform, there are still soem issues. First, is the lack of different gender choices, since we already know that there are plenty of gender identifies that does not fall into the gender binary. Second, is the dataset only having binary genders for Civilians. This righfully exludes all non-binary genders and misgenders peoples. The third issue with this data set is that the statistics show the whole population as either male or female, which makes it hard to to confide in as reliable data on gender identification.
In a 2019 Williams Institute Survey 5.1% of people olfer than 18 in NYC identiified themselves as LGBTQ. Although this survey strictly had binary gender and excludes non-binary genders in itself, this gives us a good analystics of the LGBTQ communitty population. This community includes gender identifications that do not fall into the gender binary. This further proves the exclusion of non-binary genders being accurately documented.
Examples of Lack on Inclusion on Non-Binary Gender
The graphs below are made from databases from NYC OpenData and the United States Census Bureau.
For all data sets presented, there were only binary genders being documented. Thus, exlcusing non-binary genders
from their database.
The databases presented are:
● Driver License, Permit, and Non-Driver Identification Cards Issued by County, Age, and Gender: 2011 - 2015
● Aggregate Employee Statistics of staff records with attributes (status, rank/title, gender).
● 2015-2019 American Community Survey 5-Year Estimates - AGE AND SEX
● DOHMH HIV/AIDS Annual Report
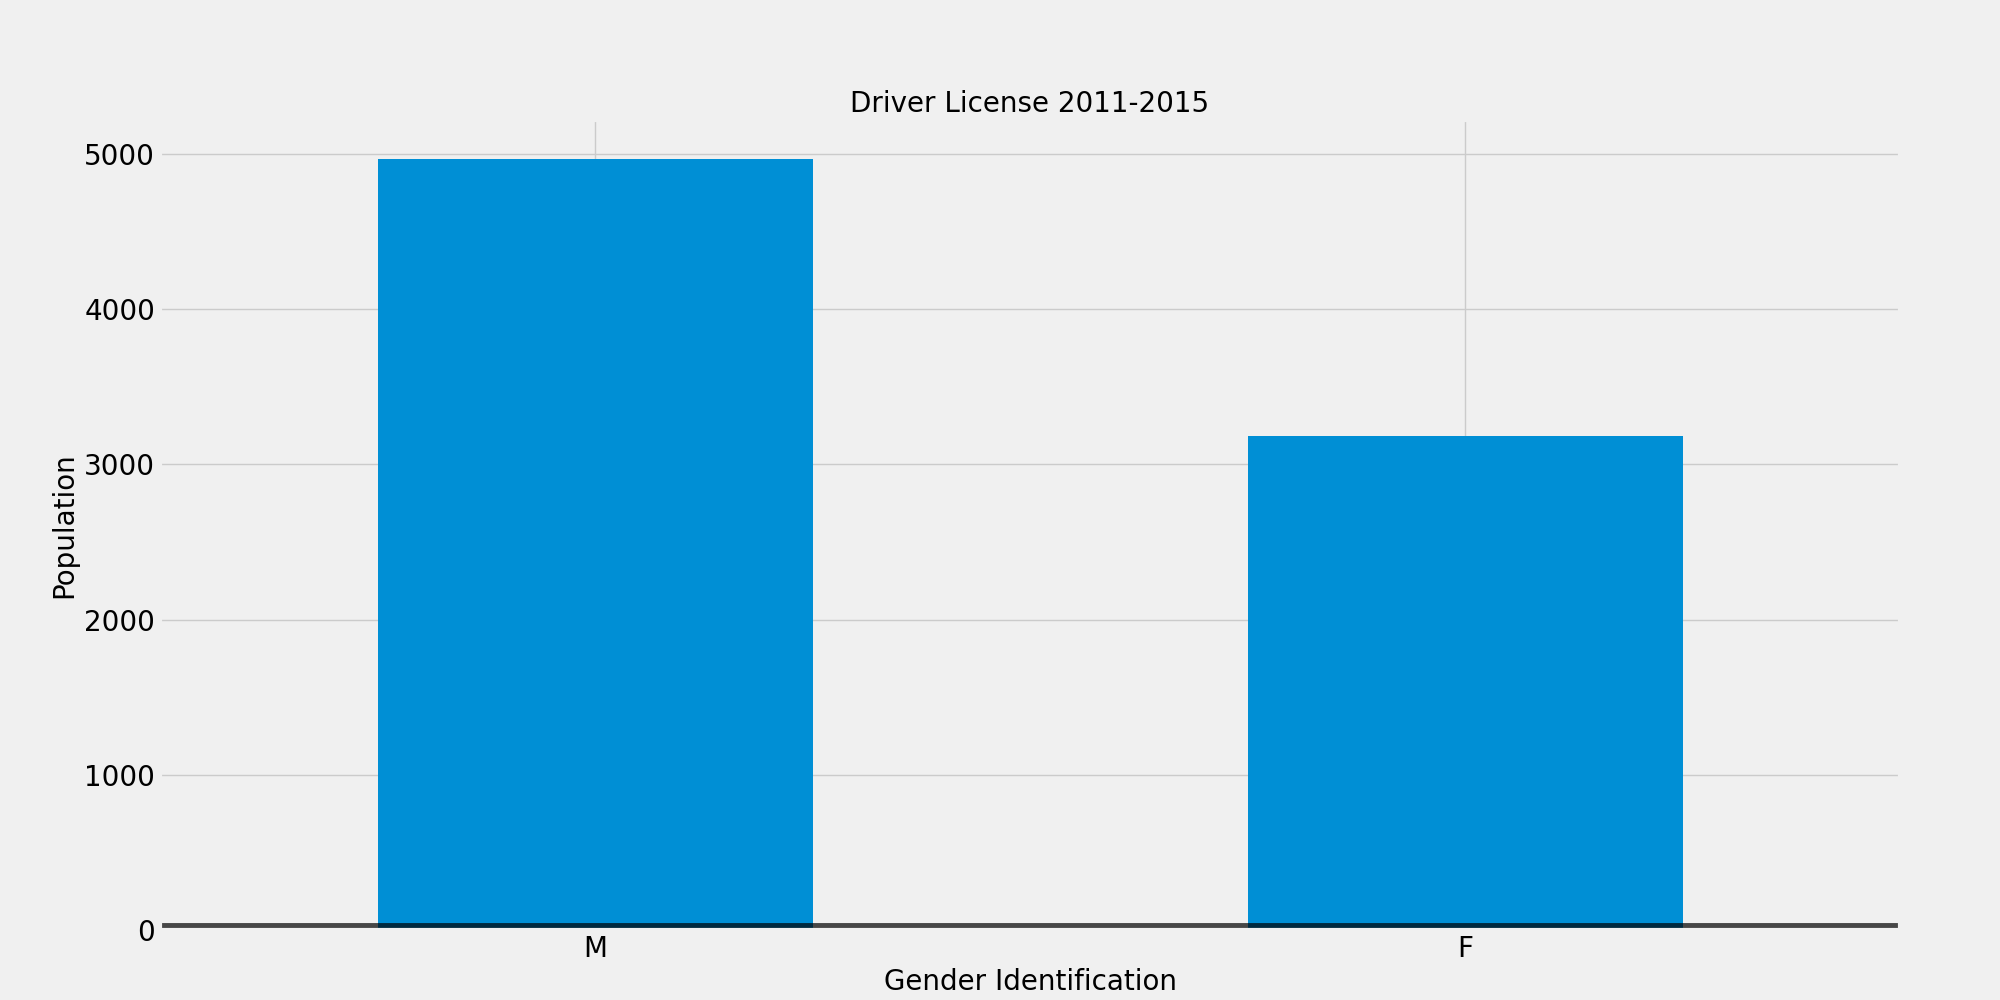
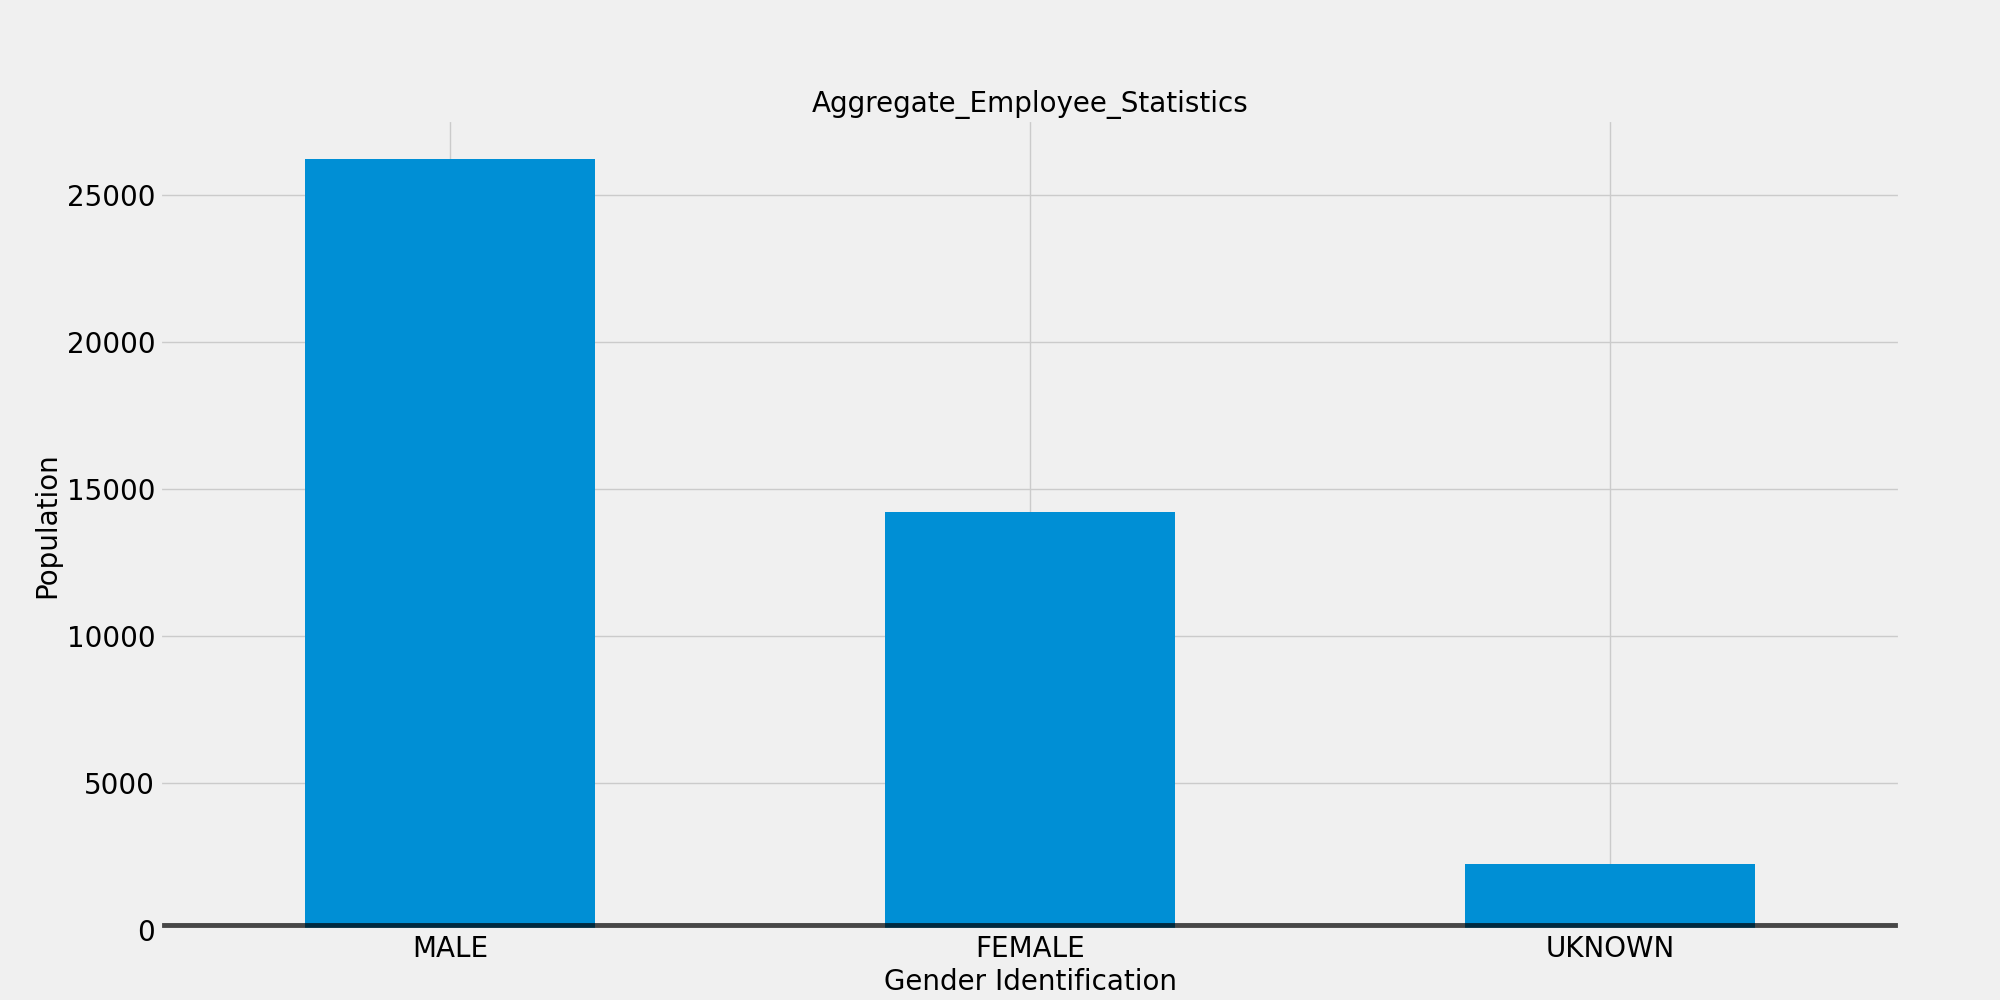
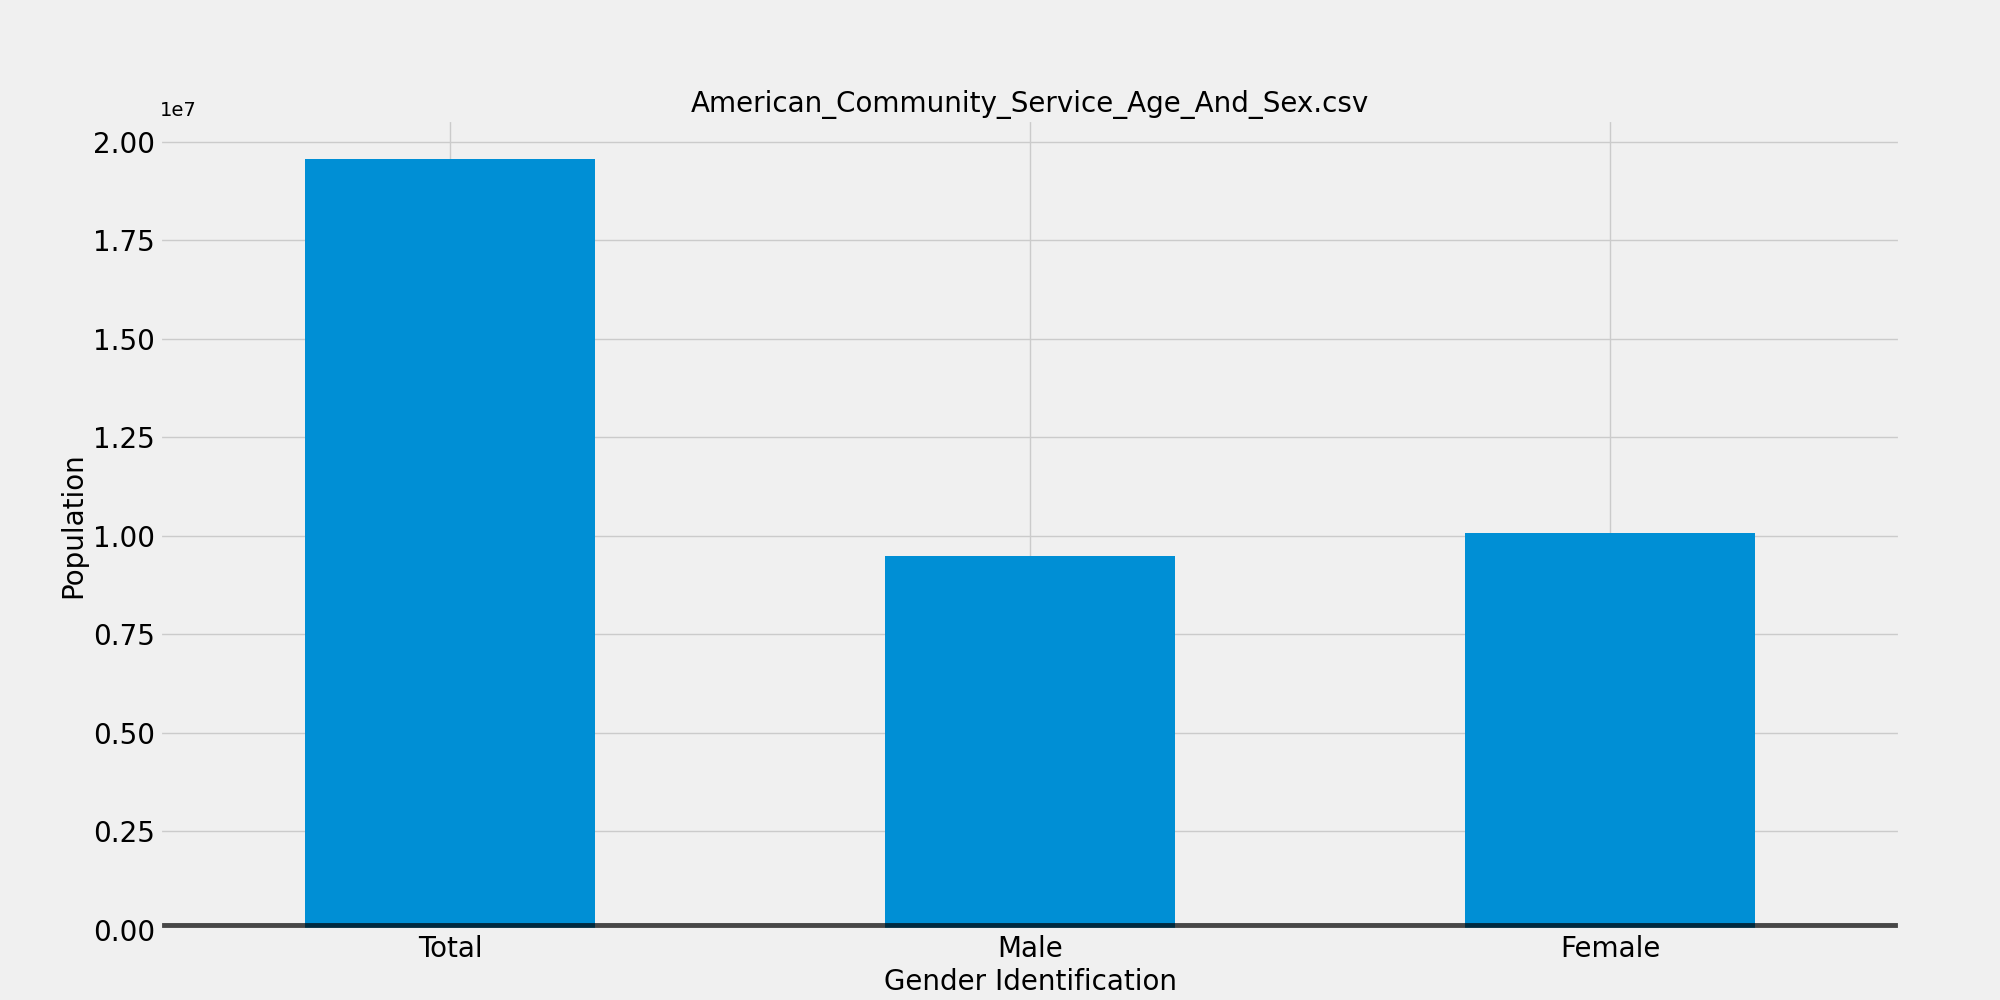
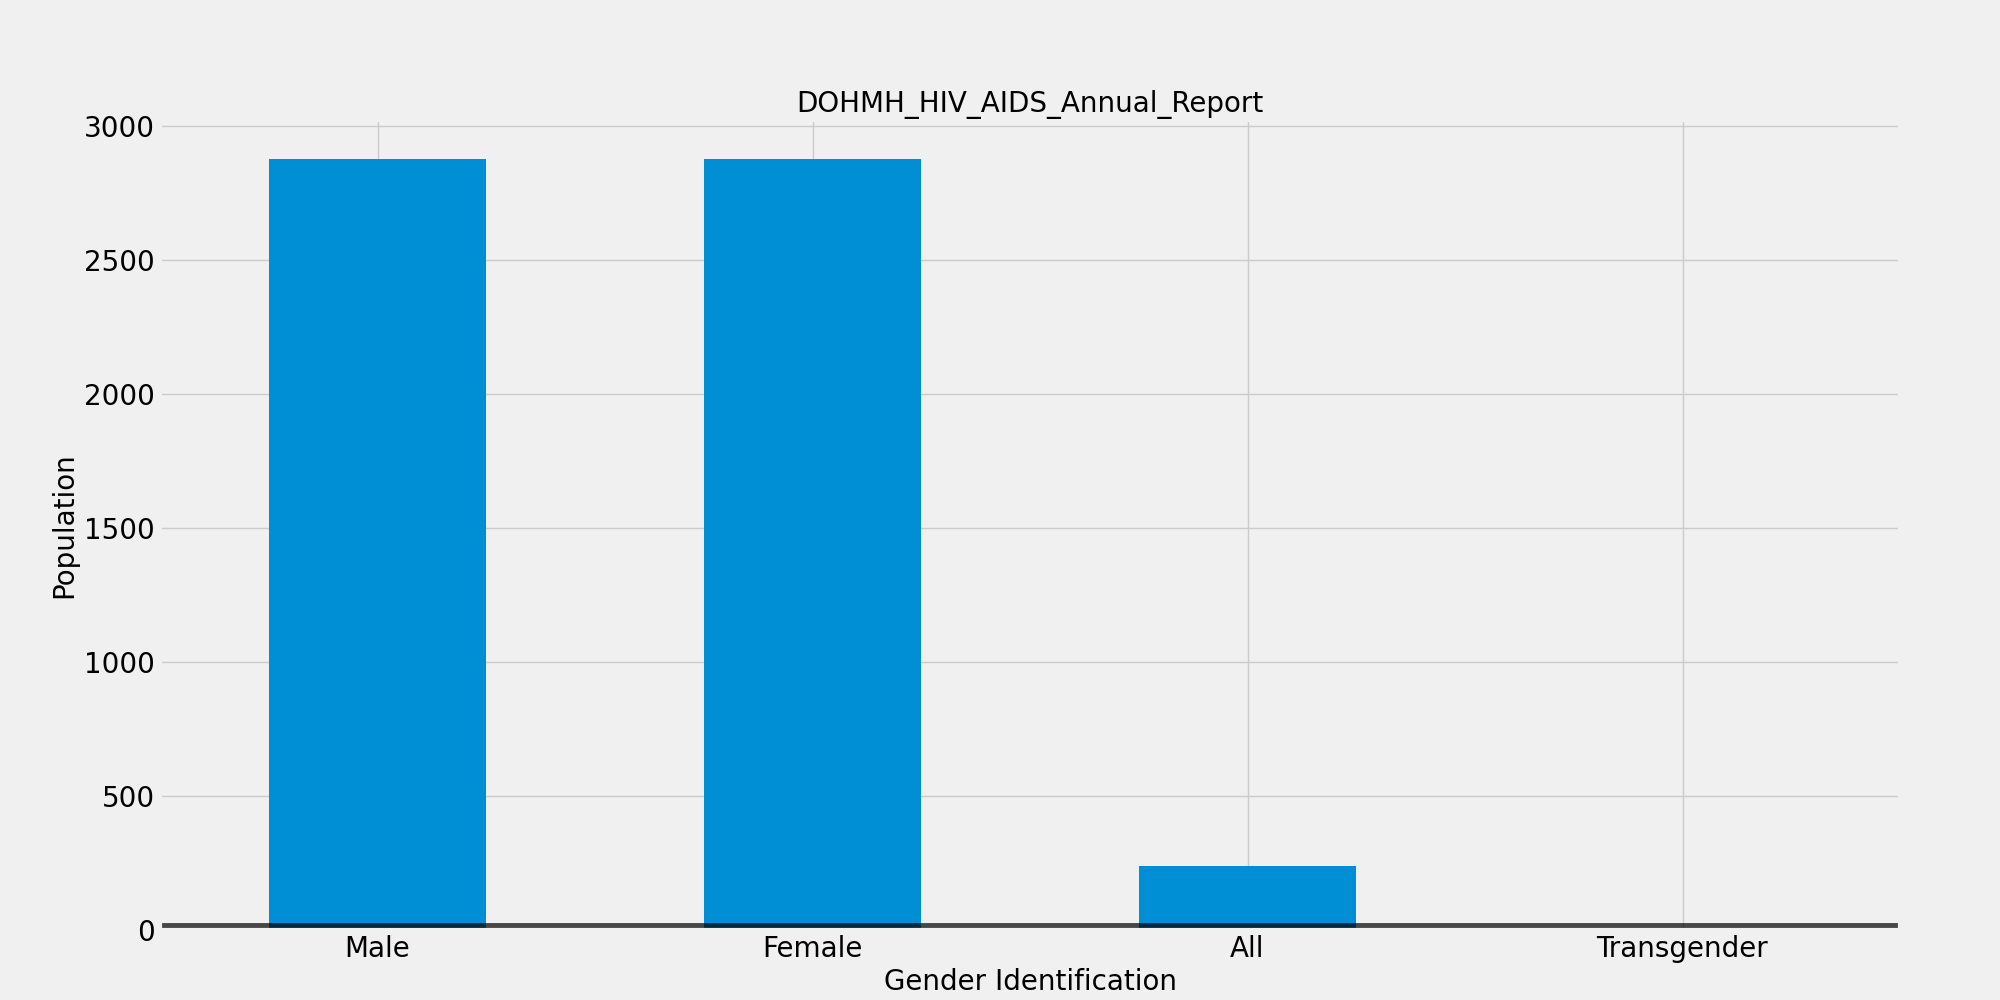
Each one is a different data set, yet all have a lack on inclusion for non-binary genders. This is misgendering and inaccurate infomration to official documentations.
Other Resources
Below are databases that help represent the inclusion of non-binary genders.
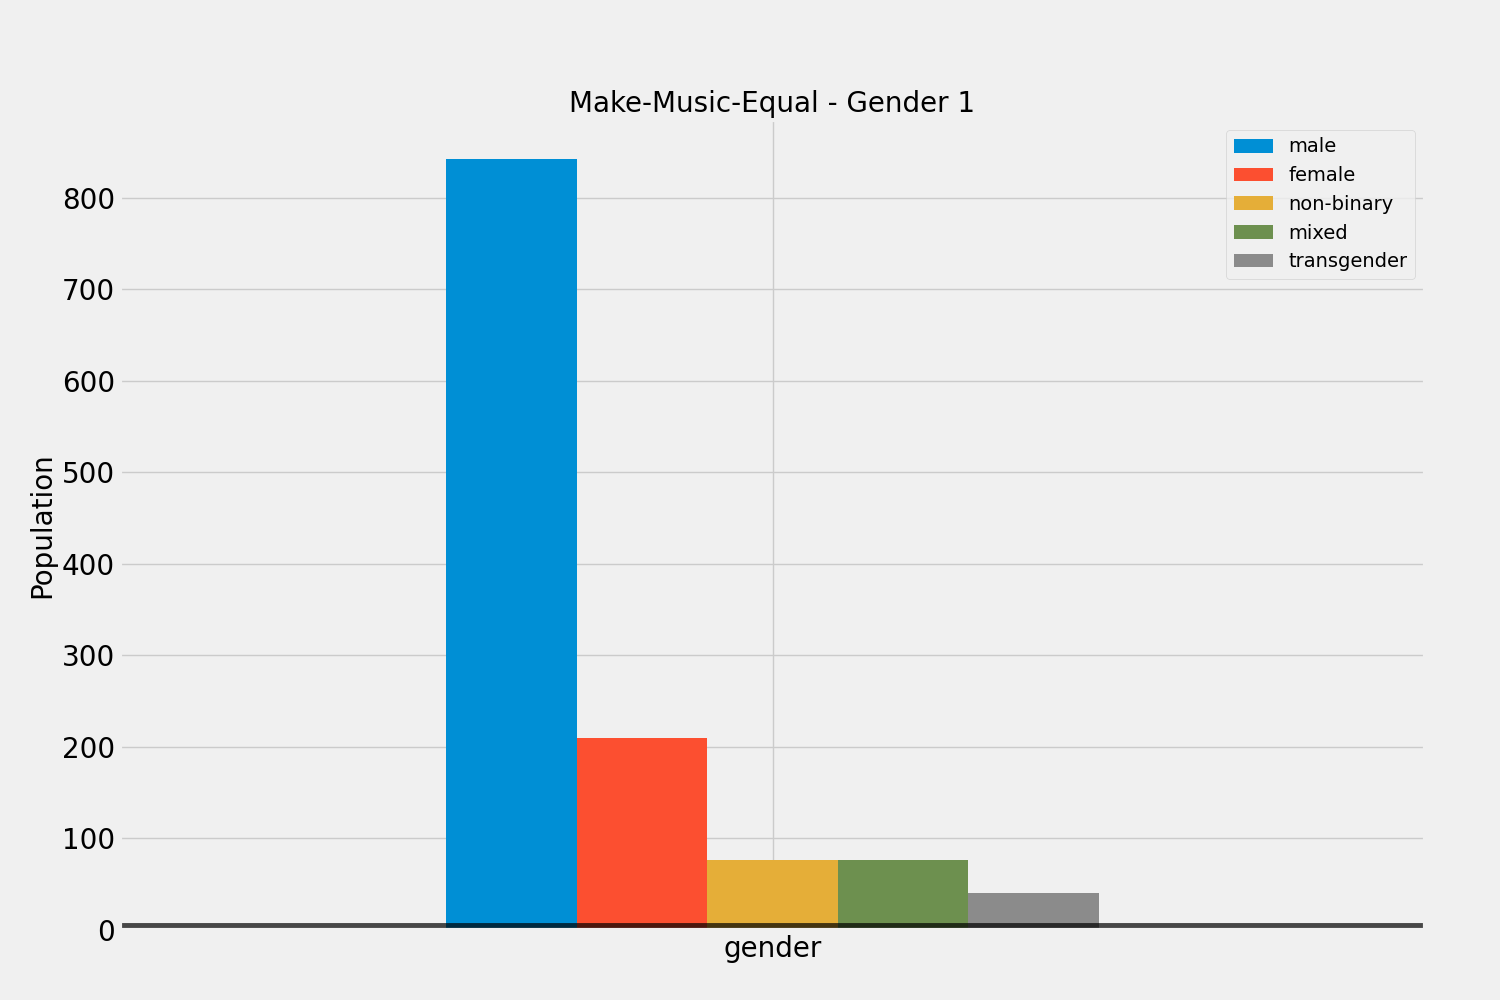
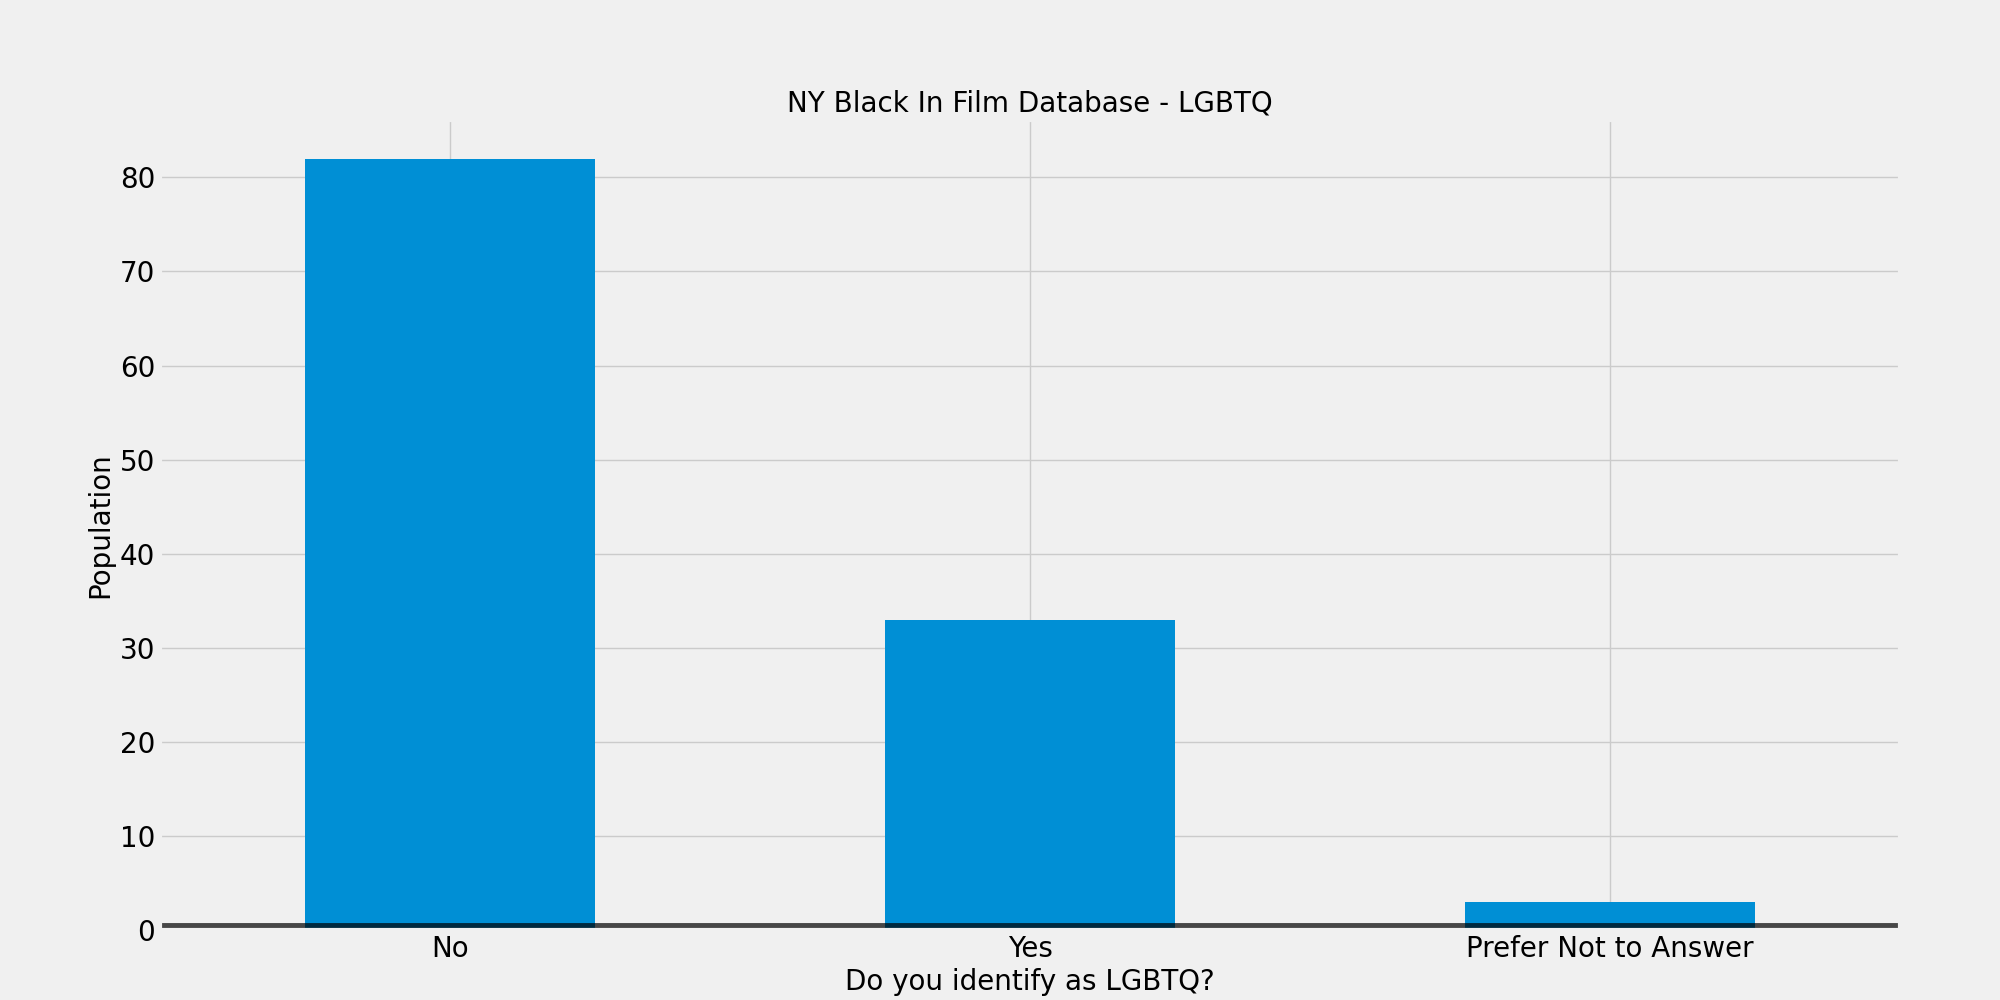
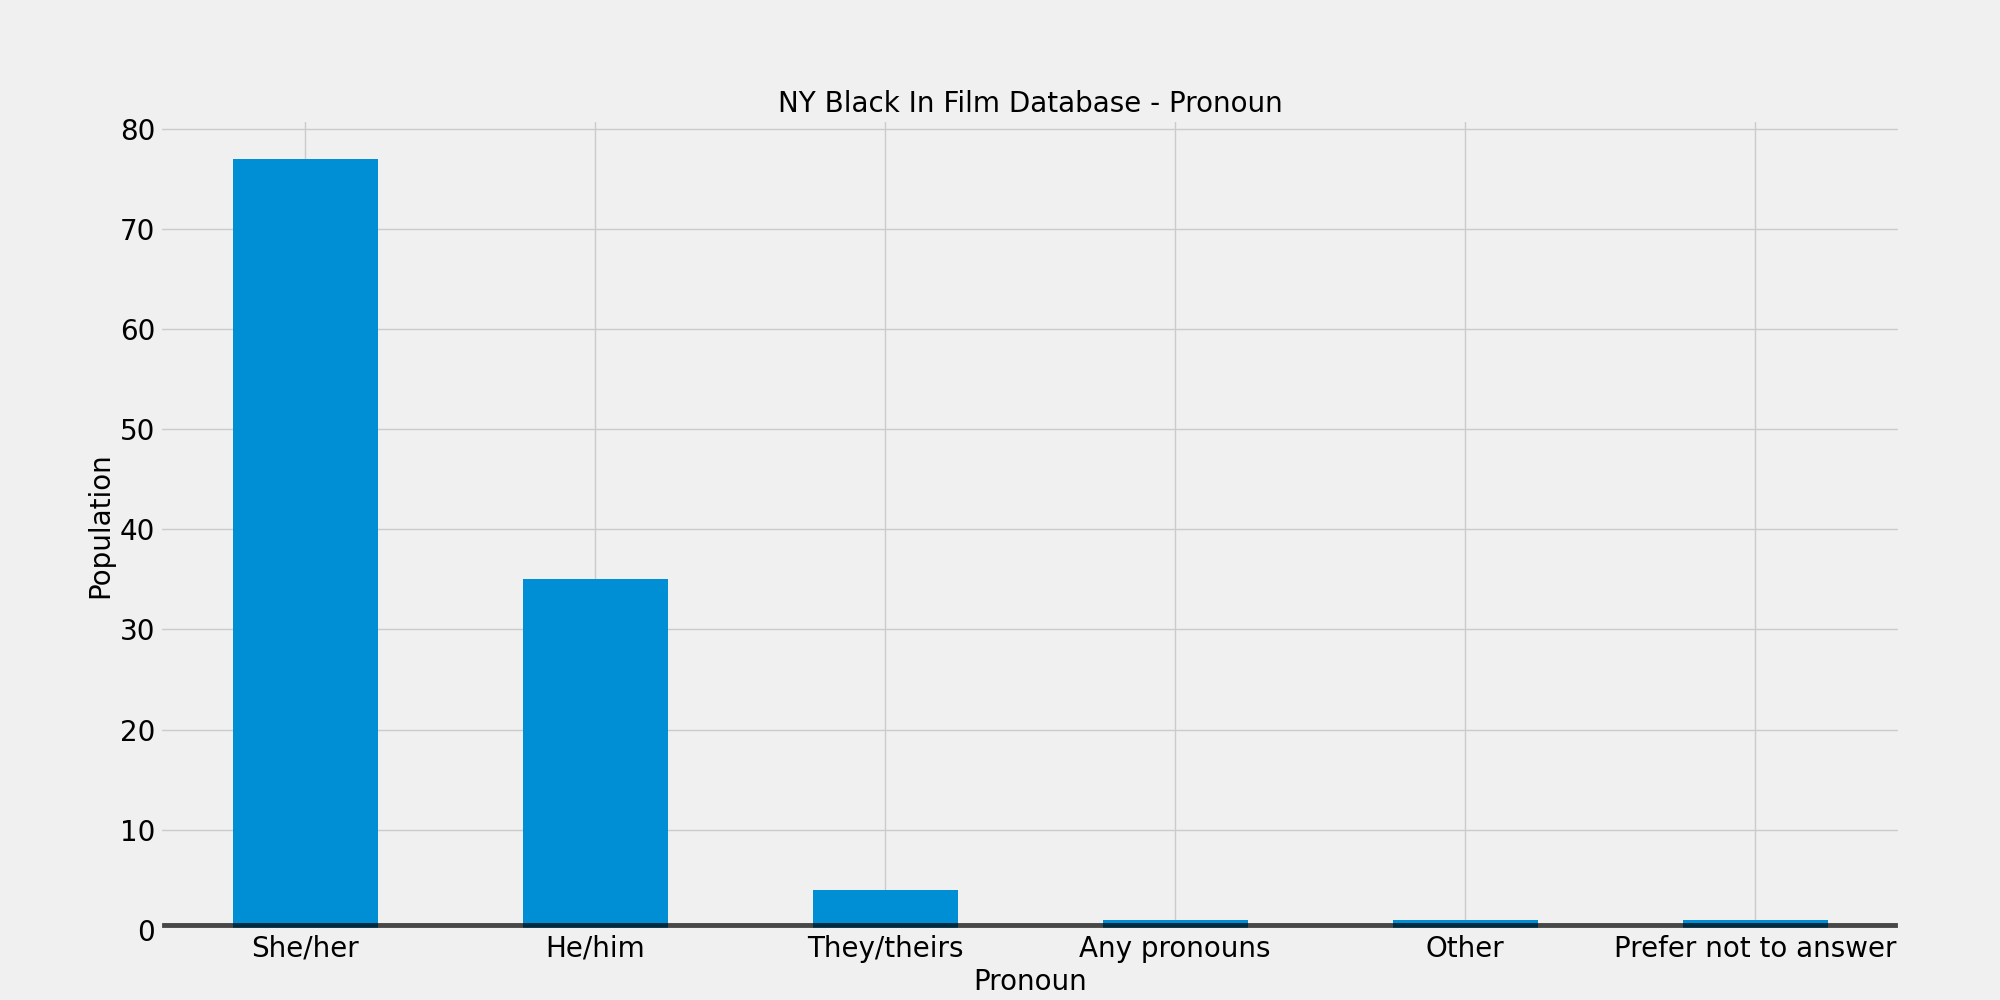
Black in Film
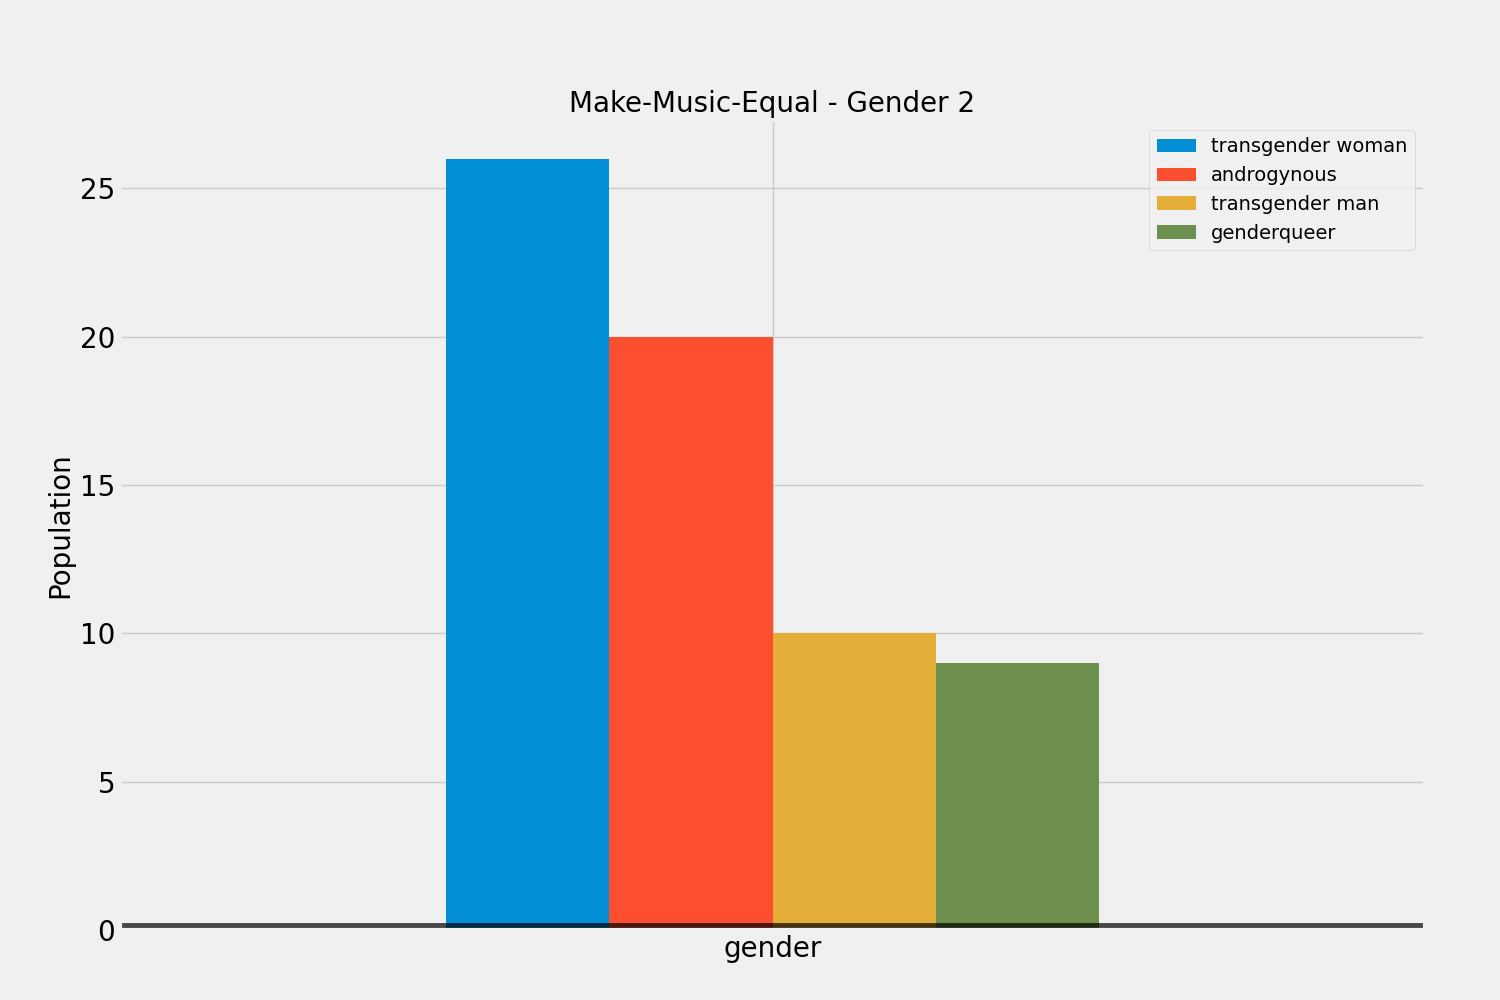
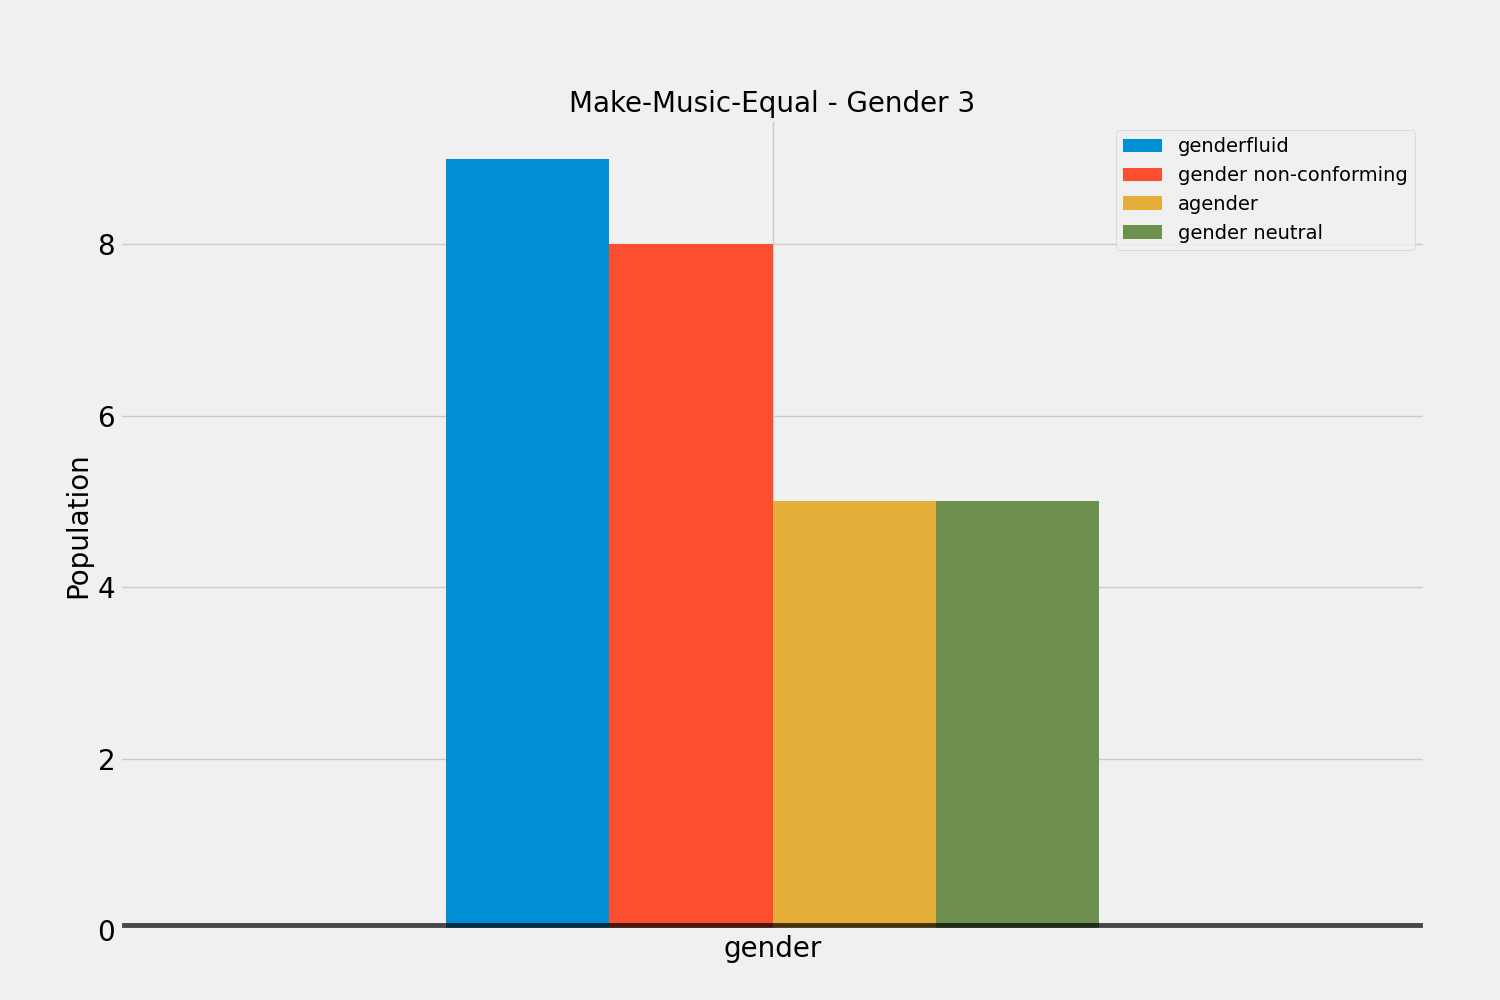
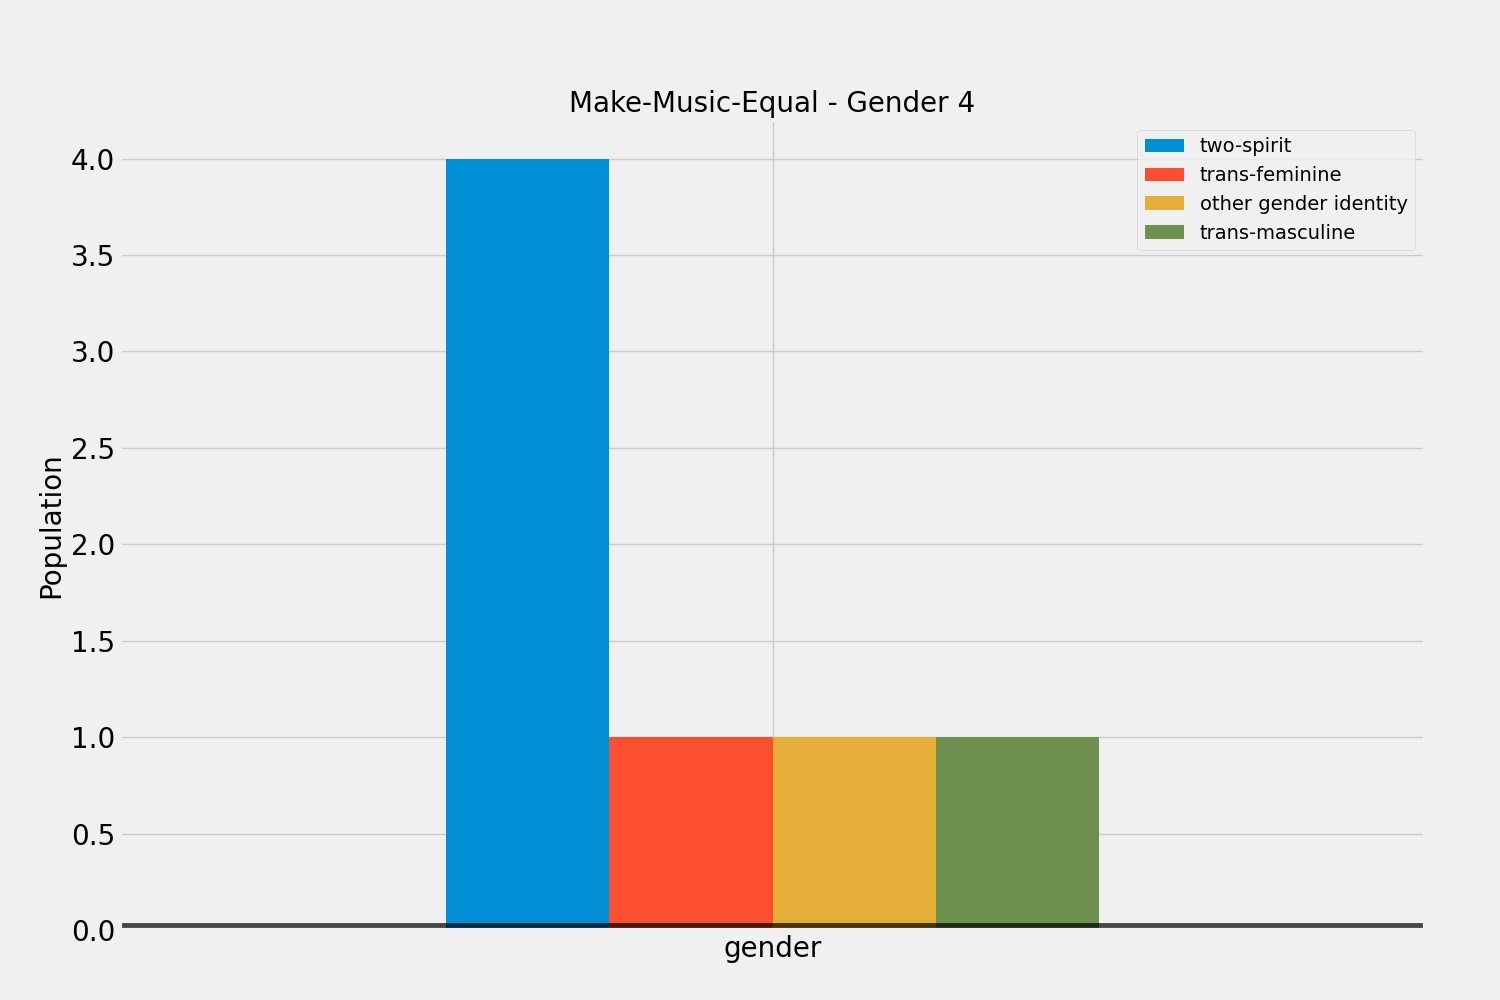
Make Music Equal